

Exploring text strings
A program’s text strings often carry a lot of information, and are a basic although essential guide while analysing binaries. In this article we’ll see how REVEN handles and presents them. We’ll also see how one can automatically use this data to gain a better understanding a program’s behavior.
The first point to note is that since REVEN works on an execution trace, it won’t try and look for static strings in every loaded binary. Instead, it aggregates the memory locations that the CPU accesses, then tries to determine if they look like strings. If it finds one that does, it will start watching it for changes and try to report them in a way that makes sense to the user. The result we’ll end up with is a list of potential strings, along with a list of execution points when those strings have been accessed.
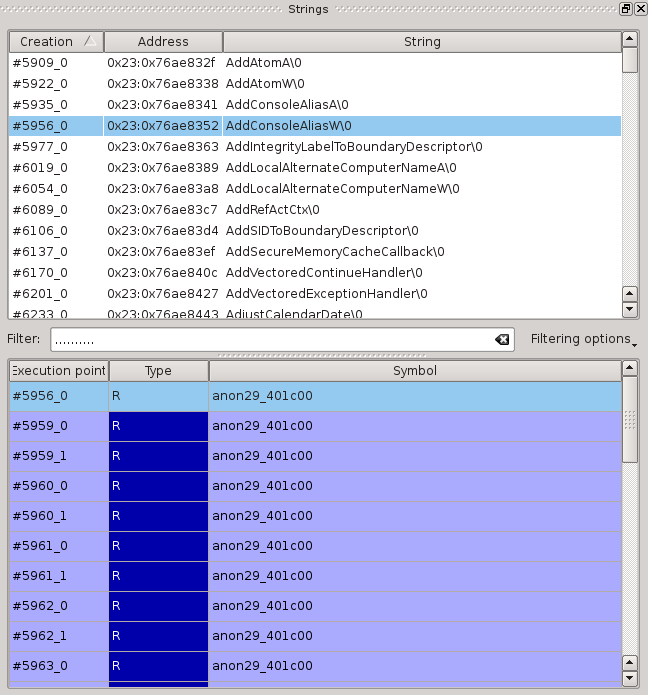
This is what the string list looks like in Axion:
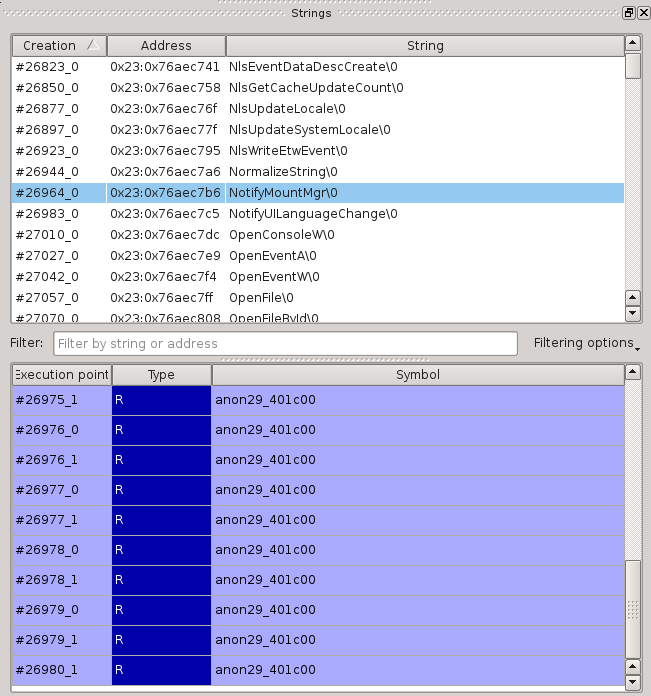
We can see the list of strings at the top and, for the currently selected string, its list of accesses. If we double-click on one of the accesses, the trace scrolls to that execution point:
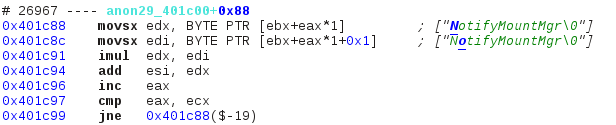
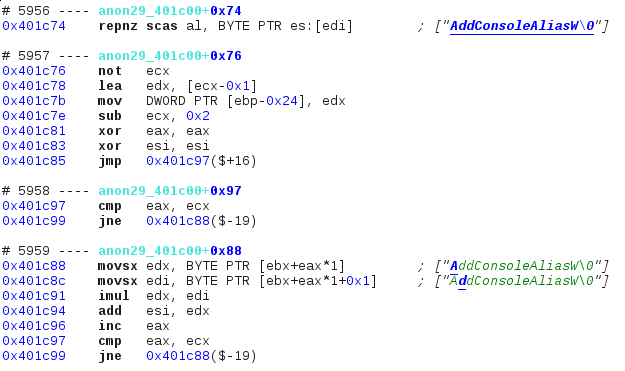
The annotations on the right were automatially added; they give the user information about what is happening at this instruction. We see in bold which character of which string is being manipulated: blue is for read operations while red is for write operations. The rest of the string is green, which means it is currently left untouched but will be read later on. In this example the entire string is in memory, but that is not always the case: if characters are being appended to a string, then the latter will be shown as is it at the execution point. We can see such a case later in the program:
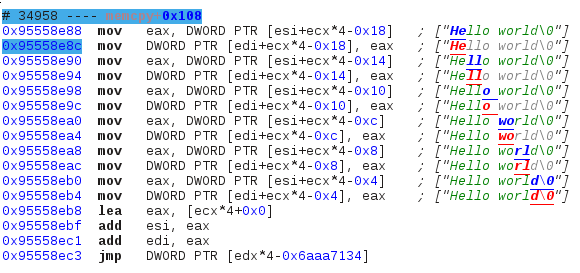
The end of the string being written is displayed in light grey because although that part is not yet in memory, it will be at the end of the append operation. If we check that memory location in the hexdump view this is what we see:

Only the first two characters of the string are in memory, the rest is still garbage. Also note that the string here is in UCS-2.
Simple use case
Let’s try and see how we can use that information on an actual program. For the purpose of this article I wrote a sample Windows program that calls a system function in a way that doesn’t leave too obvious traces. We’ll try to determine which call it is.
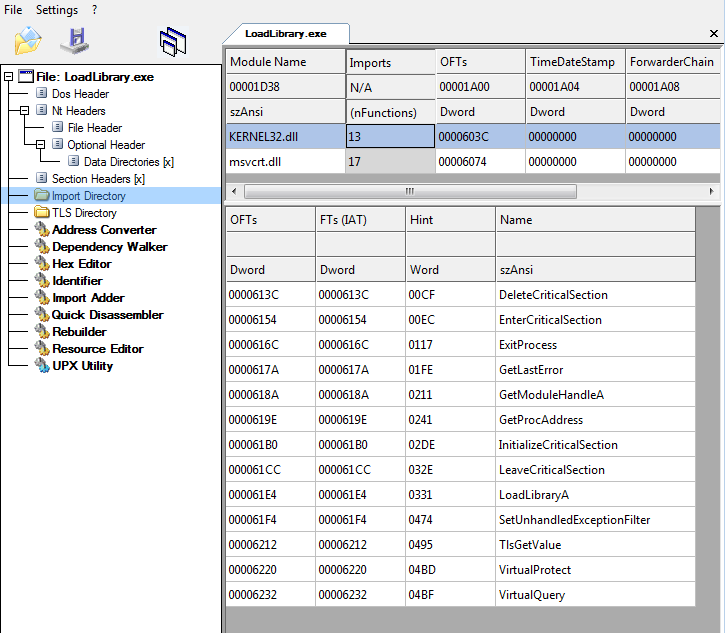
This binary’s export table doesn’t tell much:
And neither does the output of strings:
    $ strings ./LoadLibrary.exe
    [...]
    libgcj-13.dll
    _Jv_RegisterClasses
    kernel32.dll
    Hello world
    PAUSE
    Mingw runtime failure:
      VirtualQuery failed for %d bytes at address %p
      Unknown pseudo relocation protocol version %d.
      Unknown pseudo relocation bit size %d.
    DeleteCriticalSection
    EnterCriticalSection
    ExitProcess
    GetLastError
    GetModuleHandleA
    GetProcAddress
    InitializeCriticalSection
    LeaveCriticalSection
    LoadLibraryA
    SetUnhandledExceptionFilter
    TlsGetValue
    VirtualProtect
    VirtualQuery
    __getmainargs
    __p__environ
    __p__fmode
    __set_app_type
    _cexit
    _iob
    _onexit
    _setmode
    abort
    atexit
    calloc
    free
    fwrite
    memcpy
    signal
    system
    vfprintf
    KERNEL32.dll
    msvcrt.dll
Let’s create a trace in REVEN and see what strings the program manipulated. The string list shows quite a bit of noise but it’s easily filtered out: we can set a regexp that will exclude the smallest strings. This is what we get:
It’s pretty common for dynamically called symbols to show up here since their names are manipulated and compared, but here we have way too many symbols for such a small program. Let’s pick one, double click on its first access to go straight to that point, and then browse around a little to see what we can learn from the trace:
[…]
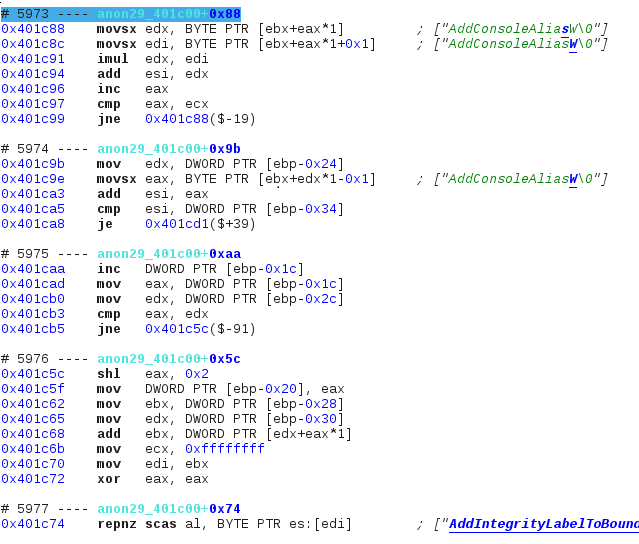
The string “AddConsoleAliasW” is a symbol name, and its pointer comes from a memory location that looks like a struct (see sequence #5976 which is the begining of the loop’s second iteration), but there is no string comparison. Instead, a single value is built into esi depending on all its characters via mul and add. When the whole string has been processed, that register is then compared to a variable stored at [ebp-0x34]. If the two values don’t match, the program loops to the next symbol name and repeats this process; otherwise it jumps out of the loop to a special location at 0x401cd1.
At this point I think it’s obvious that we’re looking at some sort of a hash function (although one I wouldn’t recommend using for any real program): for each symbol in the struct, we build a hash into esi and compare it to a local variable that contains the desired symbol’s hash. If a match is found, then at 0x401cd1 the program must somehow call the pointer associated with that symbol stored in the struct. We search for an occurence of this address in the execution trace and this is what we find:
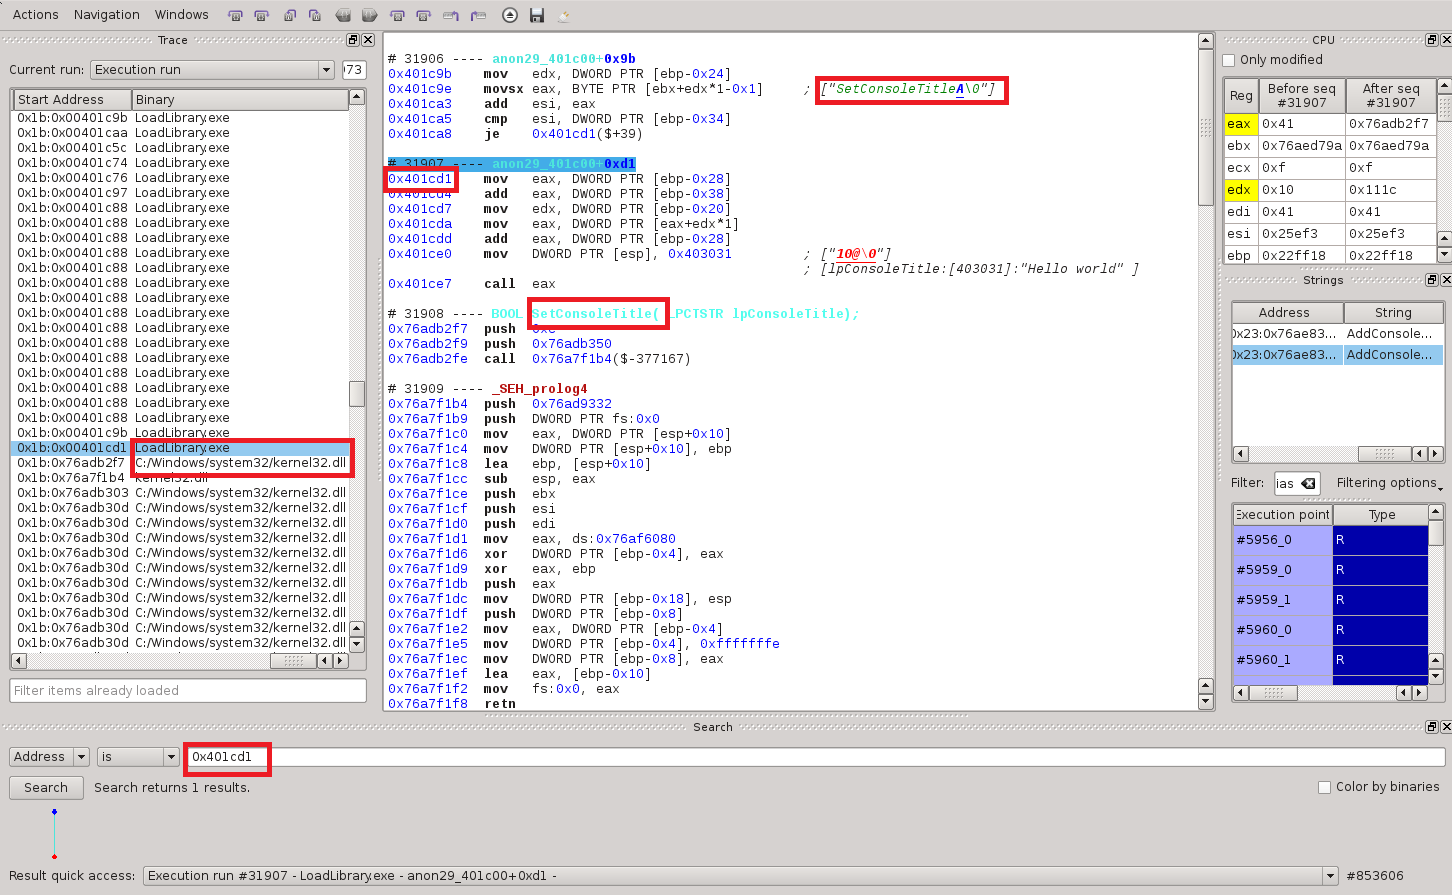
As expected, this location retrieve a pointer from that struct and calls it, which gets us right into kernel32.dll code. The string the program was hashing before the call is SetConsoleTitleA. This is confirmed by the symbol analysis just below, which also tells us that “Hello world” is being passed as an argument. And indeed, running the program confirms the analysis:
Automating the process
We have analysed one obfuscated call, but what if the search for the address had given us dozens of matches? Checking every match by hand would be tedious. Instead, we’ll use the Python API to automate the process and get a comprehensive list of every symbol that is called this way:
    search = reven.search_request(reven.filter_criterion_address(0x401cd1))
    seq_found = rvn_client.get_matching_sequences("Execution run", search)

    for node in seq_found.content:
        seq_id = node.sequence.index
        print "In sequence " + str(seq_id)
        for deref_str in rvn_client.query_dereferenced_strings_range("Execution run", seq_id-1, seq_id-1):
            print deref_str.content[:-2]
We’re asking REVEN to do exactly what we did by hand: look for every match of a specific address and, for each match, print what strings were accessed in the previous sequence. Running this on our sample binary only gives us one match as expected, but using the same technique on an actual program that uses a similar obfuscation reveals a decent amount of information about its behavior.
Conclusion
Throughout this article we have seen how REVEN detects and displays strings that are dynamically manipulated inside a program’s execution trace. We’ve seen how one can use that information to easily browse through the trace and automatically extract knowledge about the behavior of the program that is being analysed.
