


ALL-IN-ONE PLATFORM
esDynamic
Manage your attack workflows in a powerful and collaborative platform.
Expertise Modules
Executable catalog of attacks and techniques.
Infrastructure
Integrate your lab equipment and remotely manage your bench.
Lab equipments
Upgrade your lab with the latest hardware technologies.


PHYSICAL ATTACKS
Side Channel Attacks
Evaluate cryptography algorithms from data acquitition to result visualisation.
Fault Injection Attacks
Laser, Electromagnetic or Glitch to exploit a physical disruption.
Security Failure Analysis
Explore photoemission and thermal laser stimulation techniques.


EXPERTISE SERVICES
Evaluation Lab
Our team is ready to provide expert analysis of your hardware.
Starter Kits
Build know-how via built-in use cases developed on modern chips.
Cybersecurity Training
Grow expertise with hands-on training modules guided by a coach.


ALL-IN-ONE PLATFORM
esReverse
Static, dynamic and stress testing in a powerful and collaborative platform.
Extension: Intel x86, x64
Dynamic analyses for x86/x64 binaries with dedicated emulation frameworks.
Extension: ARM 32, 64
Dynamic analyses for ARM binaries with dedicated emulation frameworks.
DIFFERENT USAGES
Penetration Testing
Identify and exploit system vulnerabilities in a single platform.
Vulnerability Research
Uncover and address security gaps faster and more efficiently.
Malevolent Code Analysis
Effectively detect and neutralise harmful software.
Digital Forensics
Collaboratively analyse data to ensure thorough investigation.


EXPERTISE SERVICES
Software Assessment
Our team is ready to provide expert analysis of your binary code.
Cybersecurity training
Grow expertise with hands-on training modules guided by a coach.

INDUSTRIES
Semiconductor
Security Labs
Governmental agencies
Academics

ABOUT US
Why eShard?
Our team
Careers


FOLLOW US
Linkedin
Twitter
Youtube
Gitlab
Github


Reversing DirtyC0W


Anyone remembers the Dirtyc0w Linux kernel bug? For those who don’t, take some time to refresh your memory here. The kernel race condition is triggered from user-space and can easily lead a random local user to write into any root owned file.
In this article, we will demonstrate how esReven can help reverse engineering a kernel bug such as Dirtyc0w. Our starting point will be a scenario recording of an occurence of the bug, together with the corresponding execution trace generated by esReven. From that point on, we will:
- have a look at the POC that was used to trigger the bug
- find an interesting point to start the analysis
- time-travel and follow the data-flow backward to understand where it comes from
- find the location in the trace where the race condition occurs
- detect unique code path vs multiple instances
- find matching Linux kernel source-code and derive the missing semantic
- conclude
The esReven technology used throughout the article has been designed by eShard to perform deterministic analysis of whole running systems at the CPU, Memory, Device level. Its implementation comprises a server together with the Axion client GUI. One can also interact with the server through the esReven Python API, from Python or third-party tools such as IDA-Pro, Kd/Windbg, GDB, Wireshark, etc.
The exploit POC we’ll use
You can find the source code of the Dirtyc0w POC I’ve used here. In short the big picture is:
void print_head_target_file(const char* filename){
  //print the file content
}
void *madviseThread(void *arg){
    for()
      // always says we don't need the mapped area
      madvise(map,100,MADV_DONTNEED);
}
void *procselfmemThread(void *arg){
    int f=open("/proc/self/mem",O_RDWR);
    for()
        // always tries to write into the mmaped file through the process virtual address interface
        lseek(f,(uintptr_t) map,SEEK_SET);
        write(f,str,strlen(str));
}
int main(){
    print_head_target_file(target_filename);
    f=open(target_filename,O_RDONLY);
      //MAP_PRIVATE => will trigger the Copy On Write (COW)
      map=mmap(NULL,st.st_size,PROT_READ,MAP_PRIVATE,f,0);
      run_the_2_looping_threads
    close(f);
    print_head_target_file(target_filename);
    return 0;
}
Looking for some point to start in the trace
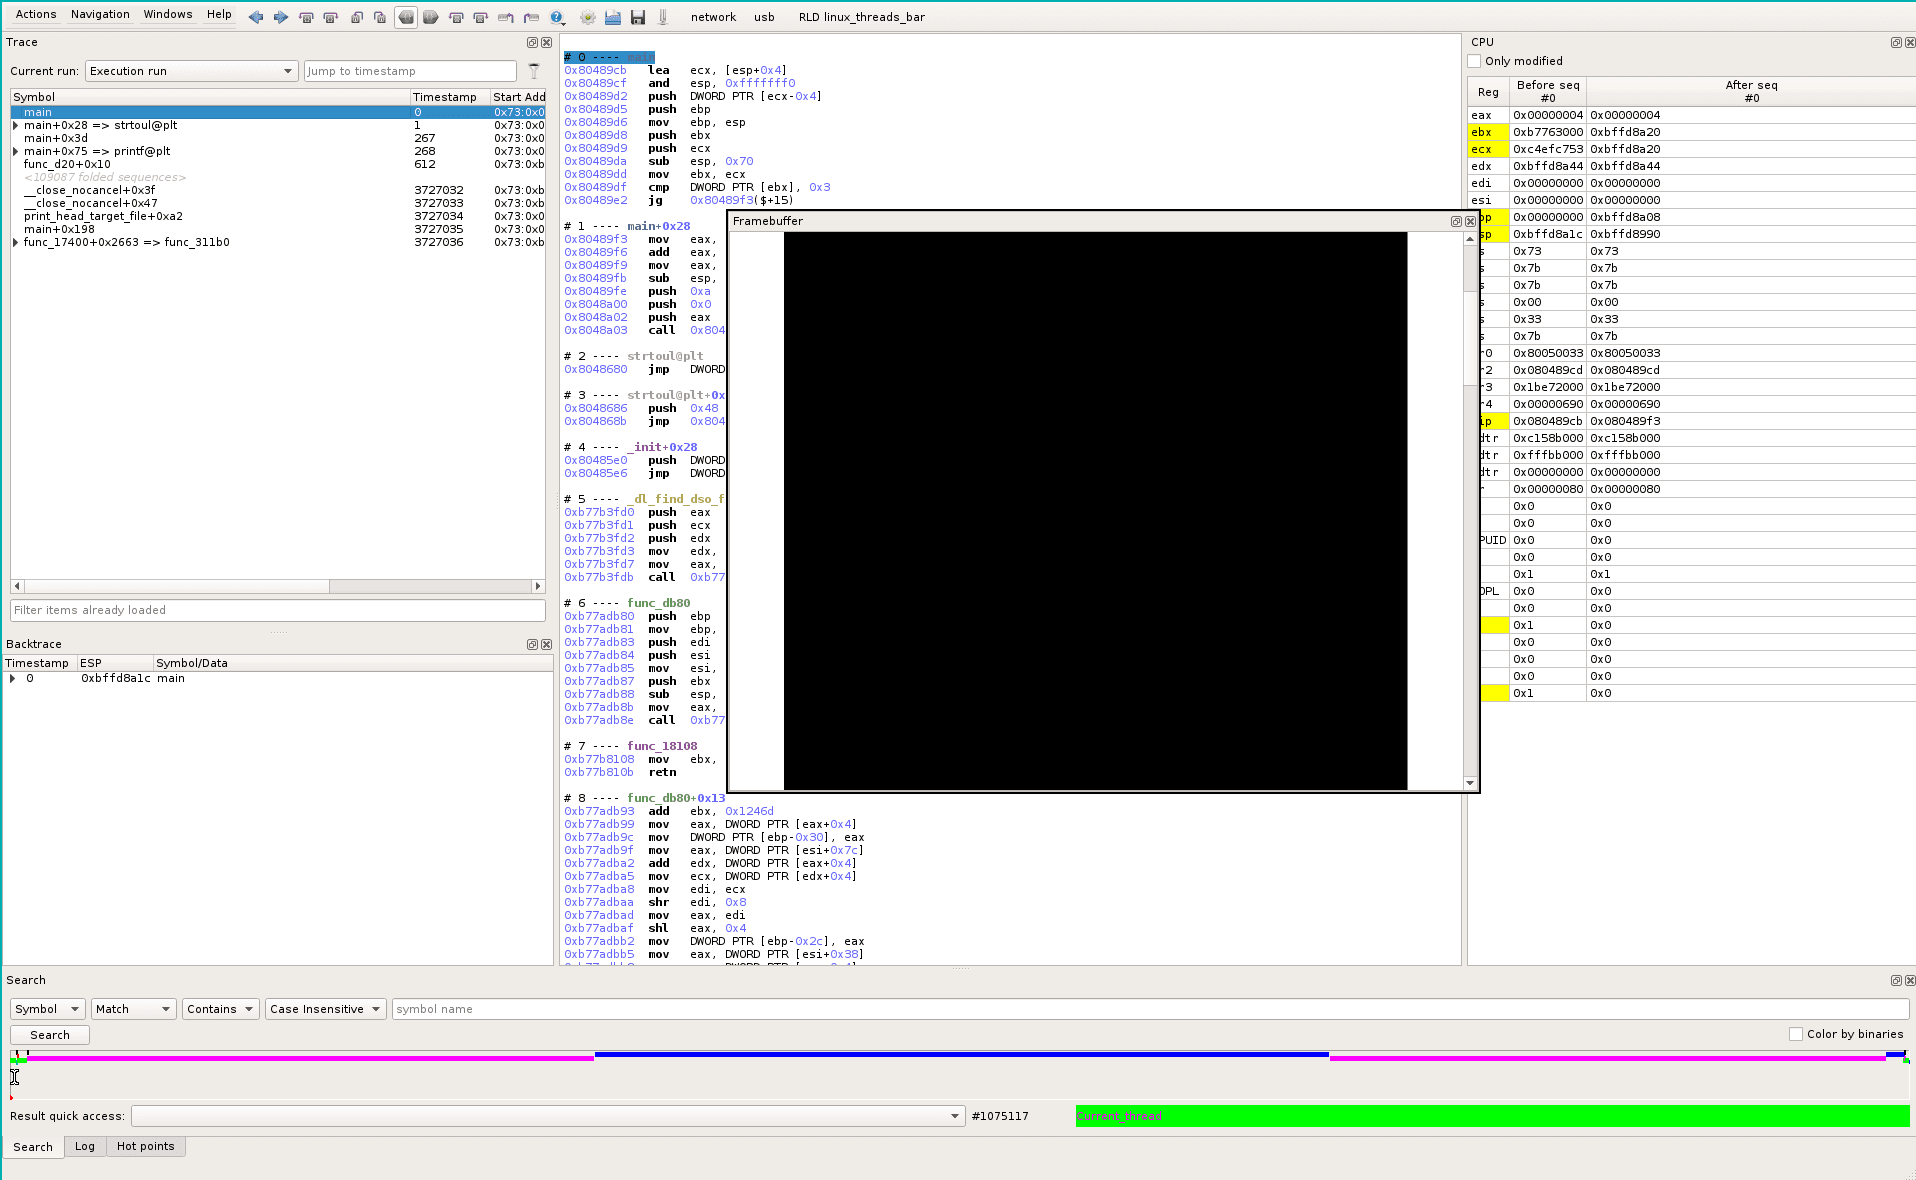
First, let’s have a look at the framebuffer at the beginning of the trace. To do this, we use the timeline widget at the bottom of the screen in Axion, placing the red dot (current position) at the full left. The framebuffer (Menu Windows->Views->Framebuffer) is quite empty:
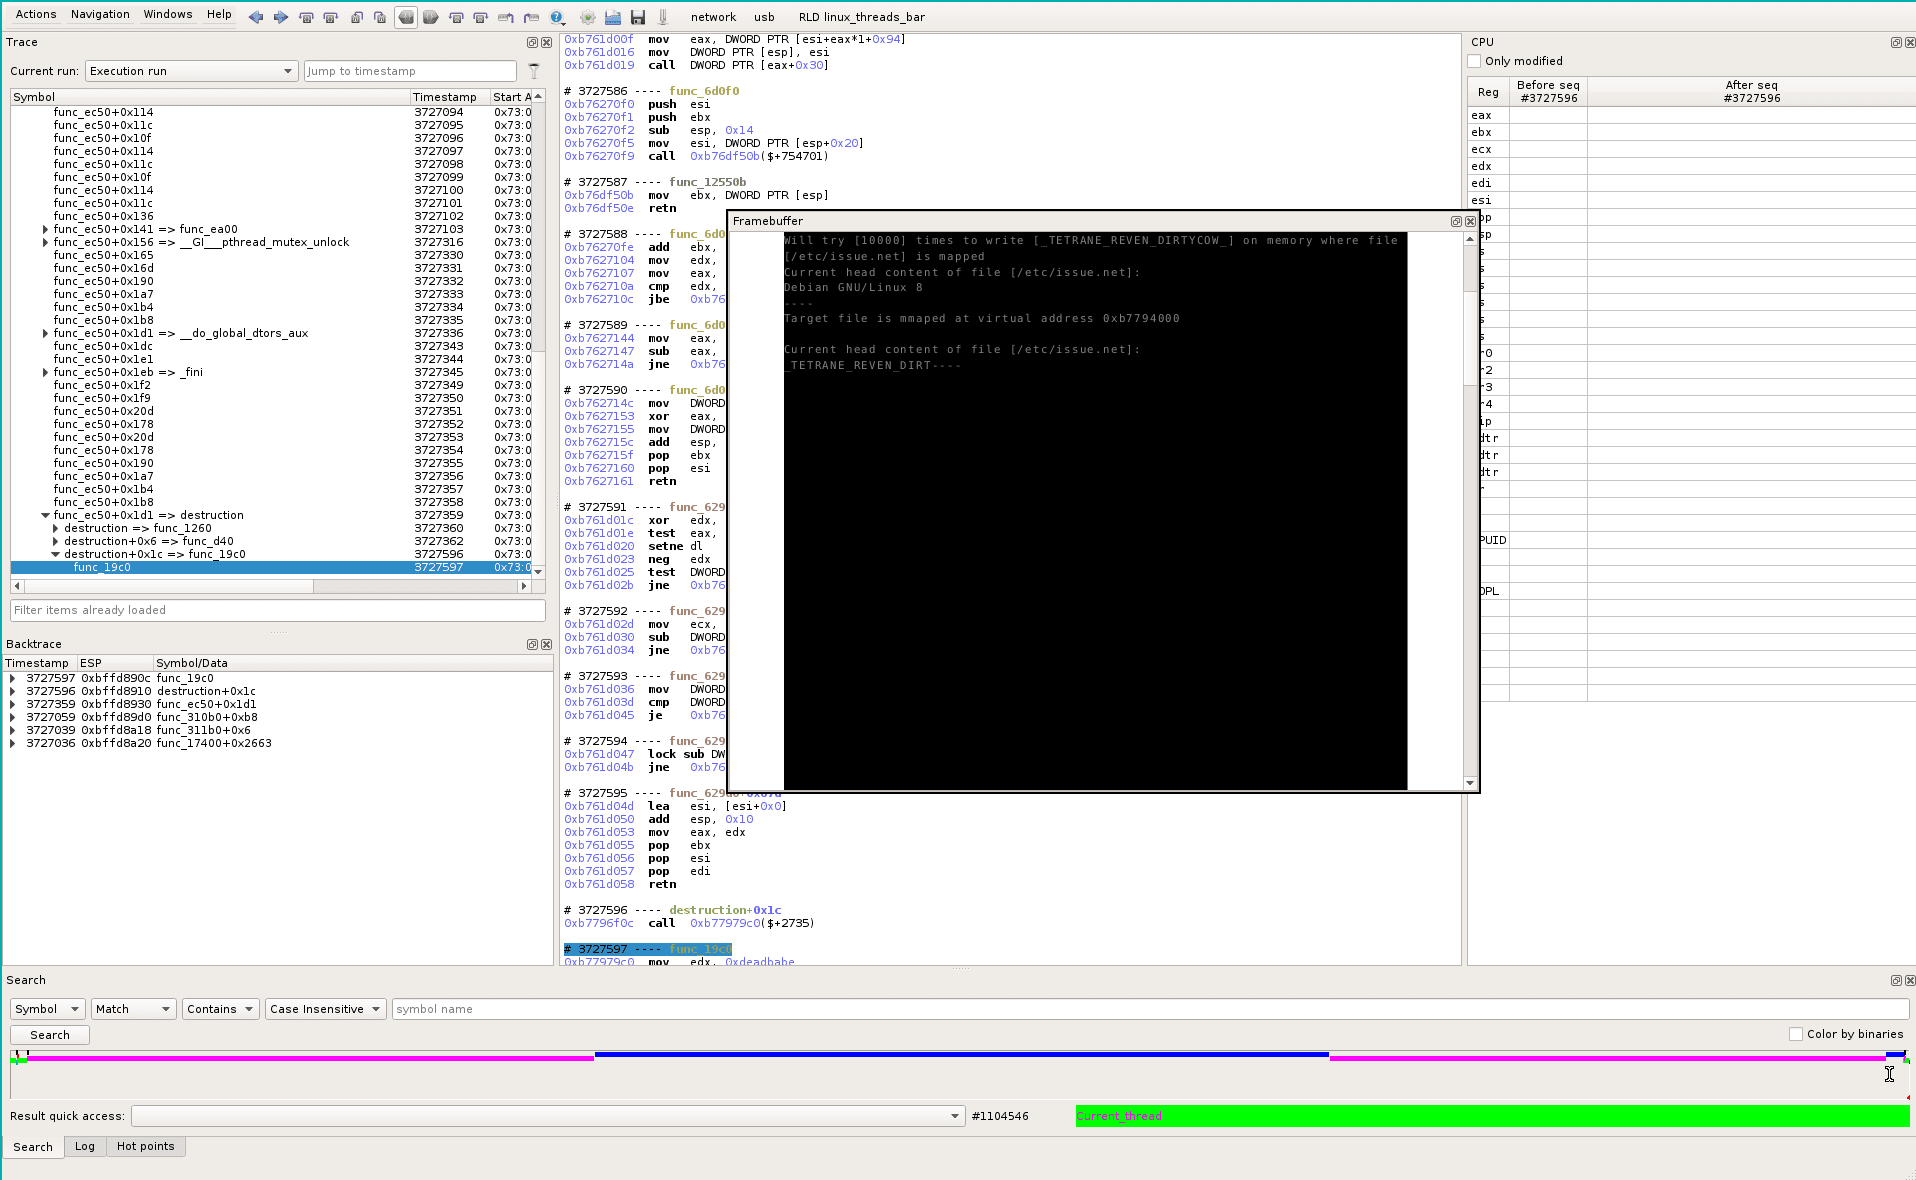
Now at the end (red dot at full right): we see that the content of the file /etc/issue.net is modified: from “Debian GNU/Linux 8” at the beginning, it becomes “_TETRANE_REVEN_DIRT” at the end. So, the recorded scenario and the trace generated by the esReven simulator successfully captured the race condition that overwrites, from a standard user account, some root-only writable file:
Following the data flow backward (time-travel)
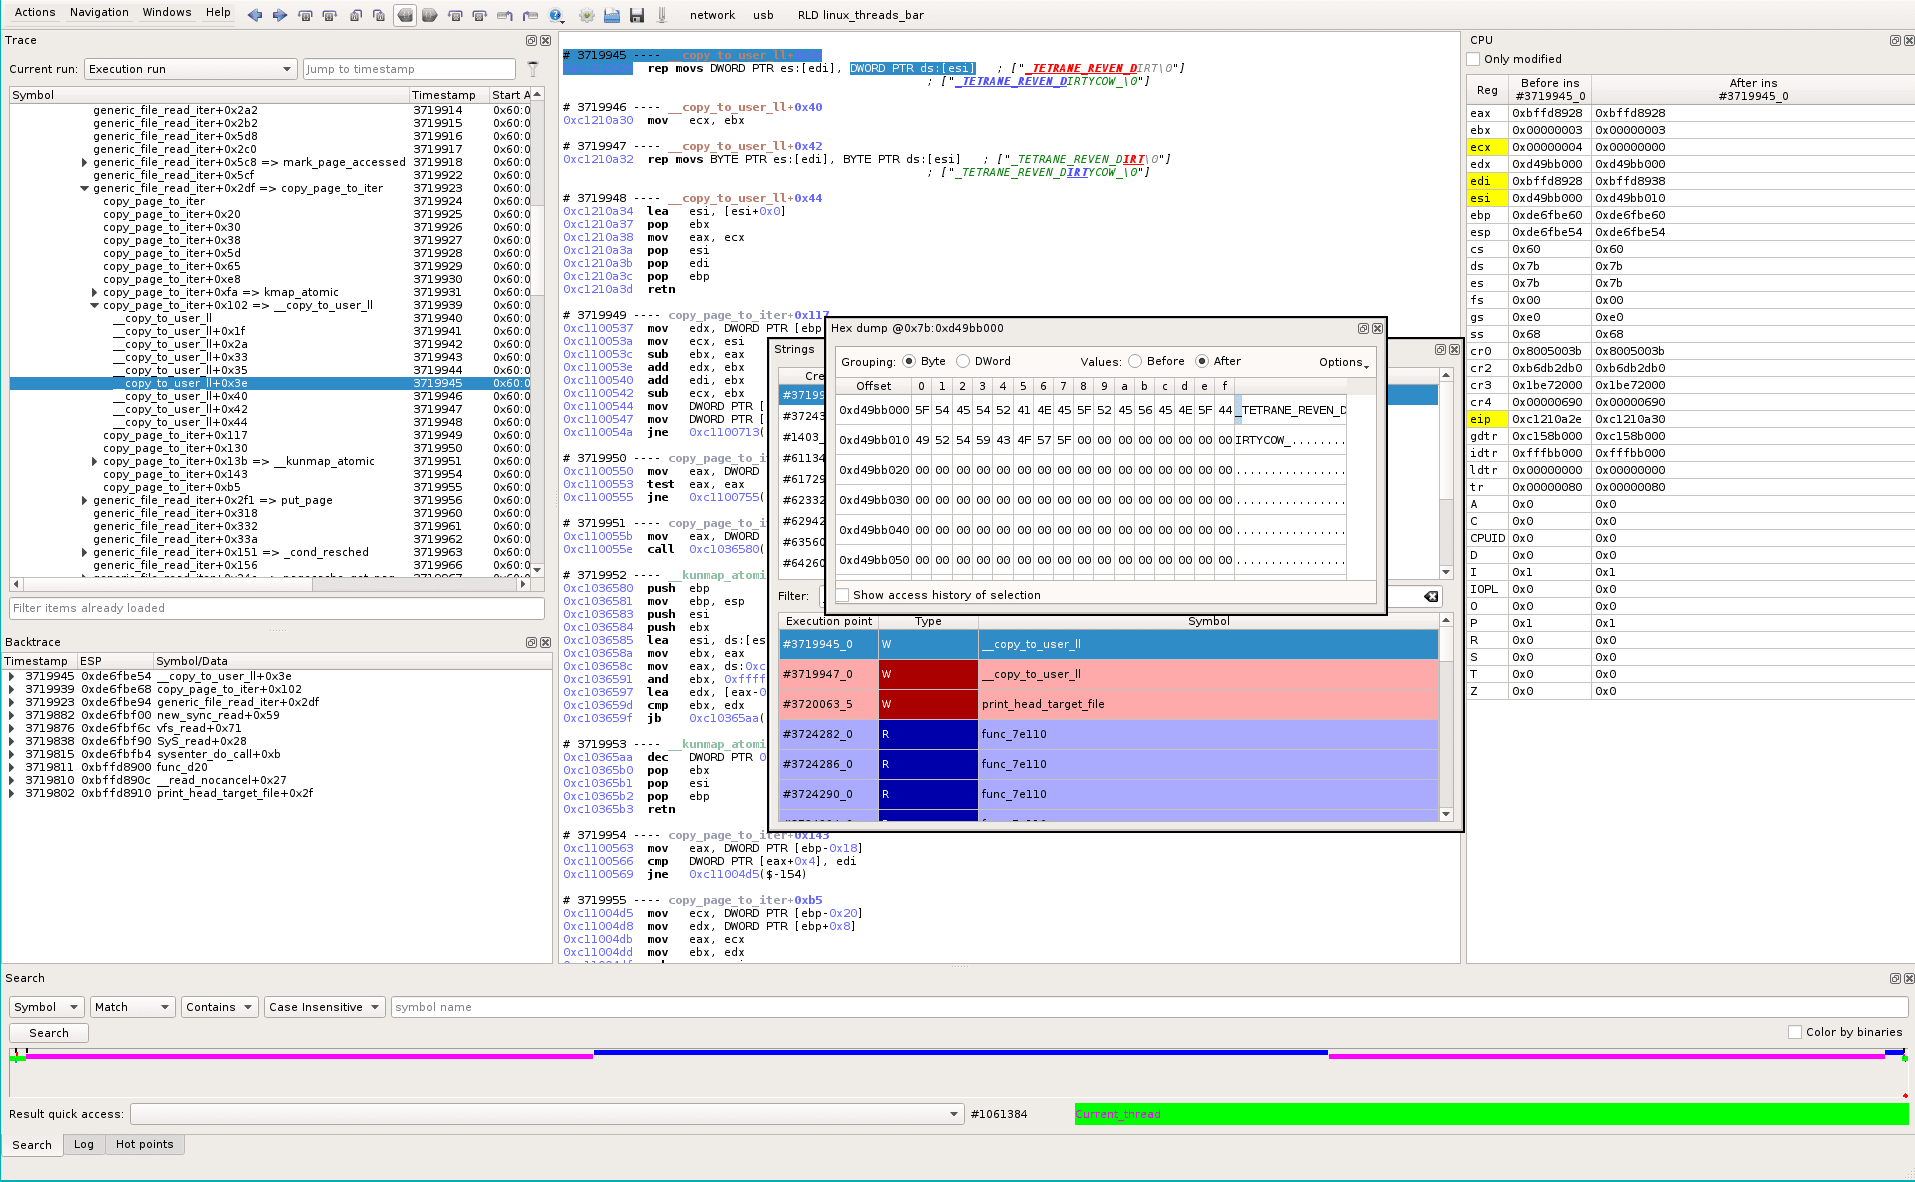
We now want to track the string “_TETRANE_REVEN_DIRT” backward in the trace. To do so, we open the REVEN-Axion Strings widget (Menu Windows->Views->Strings or shortcut alt-s), and look at the following string history:
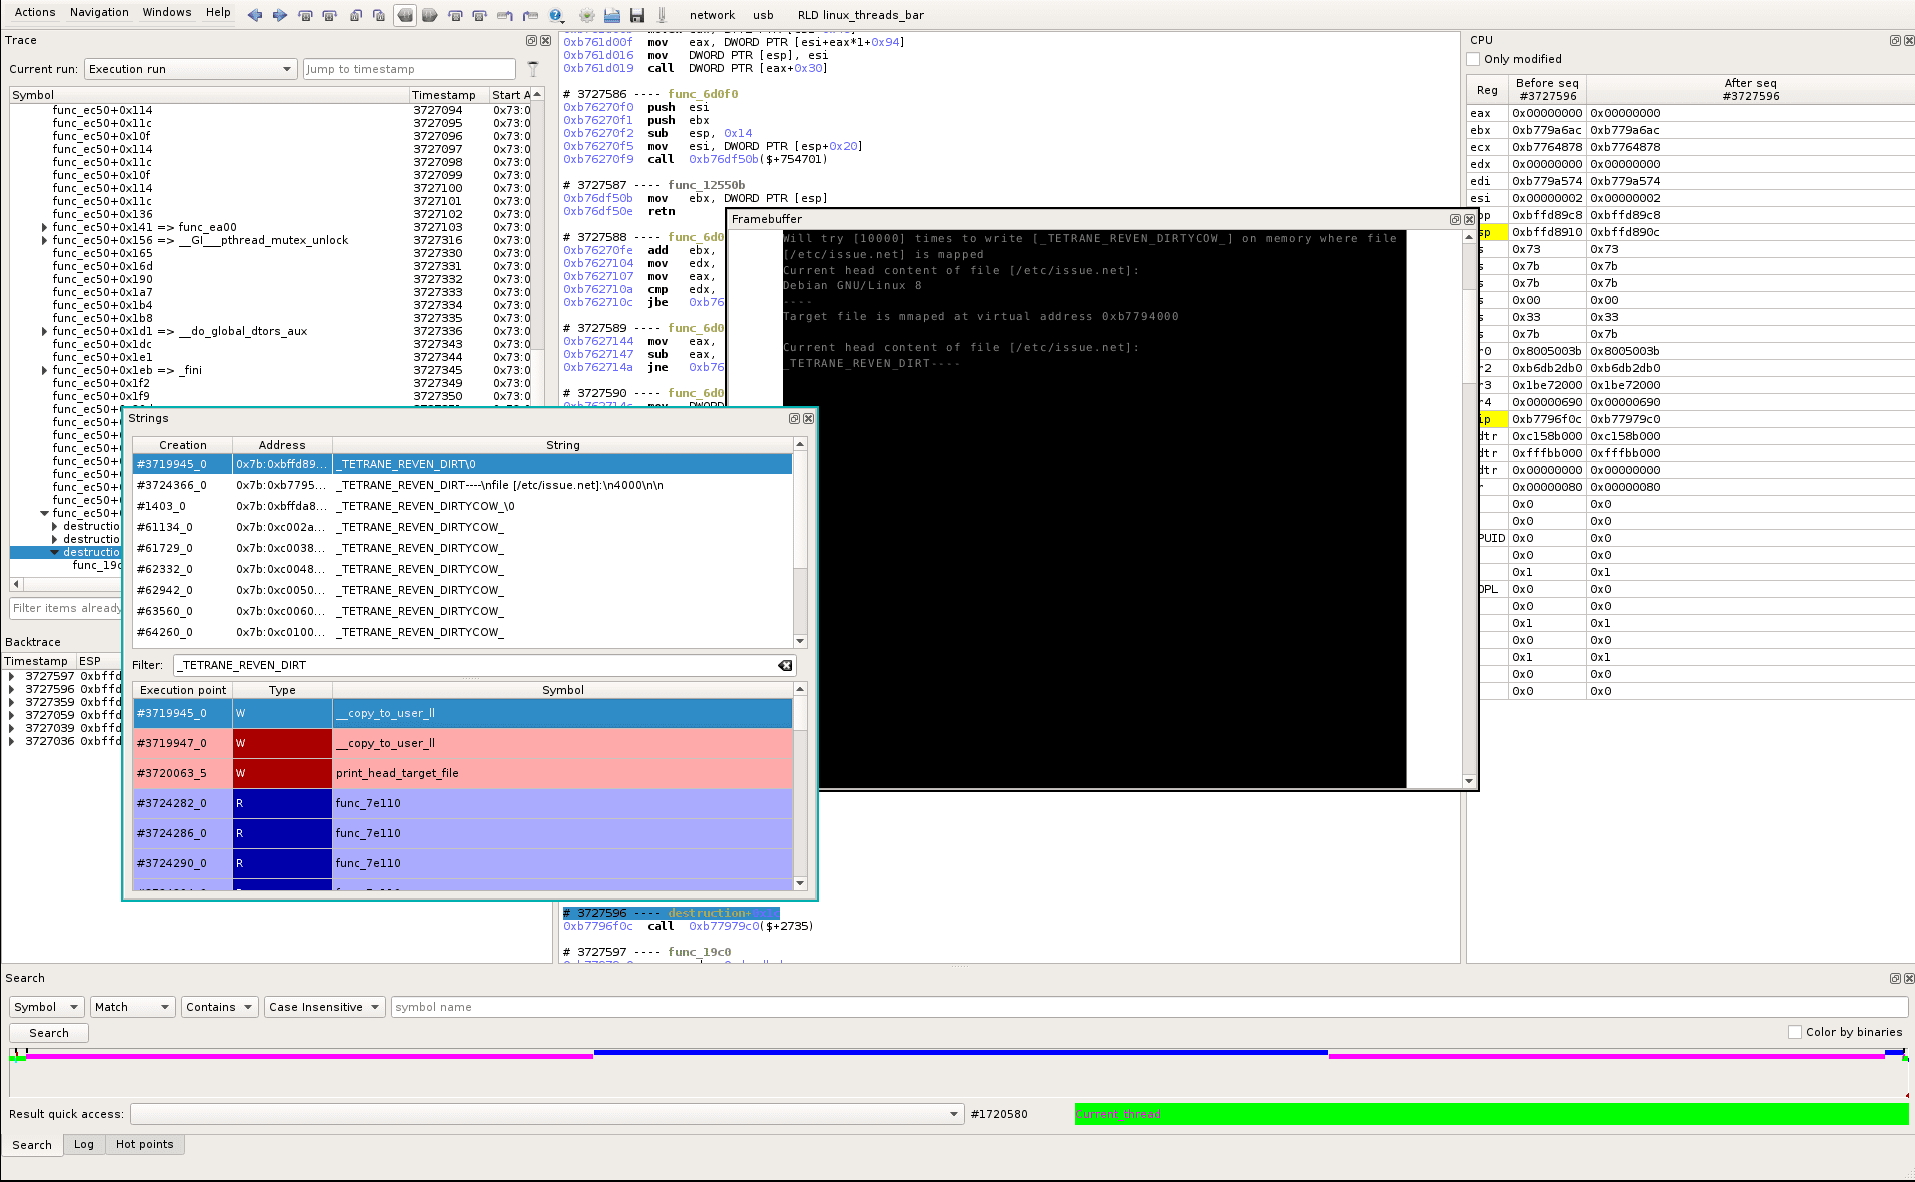
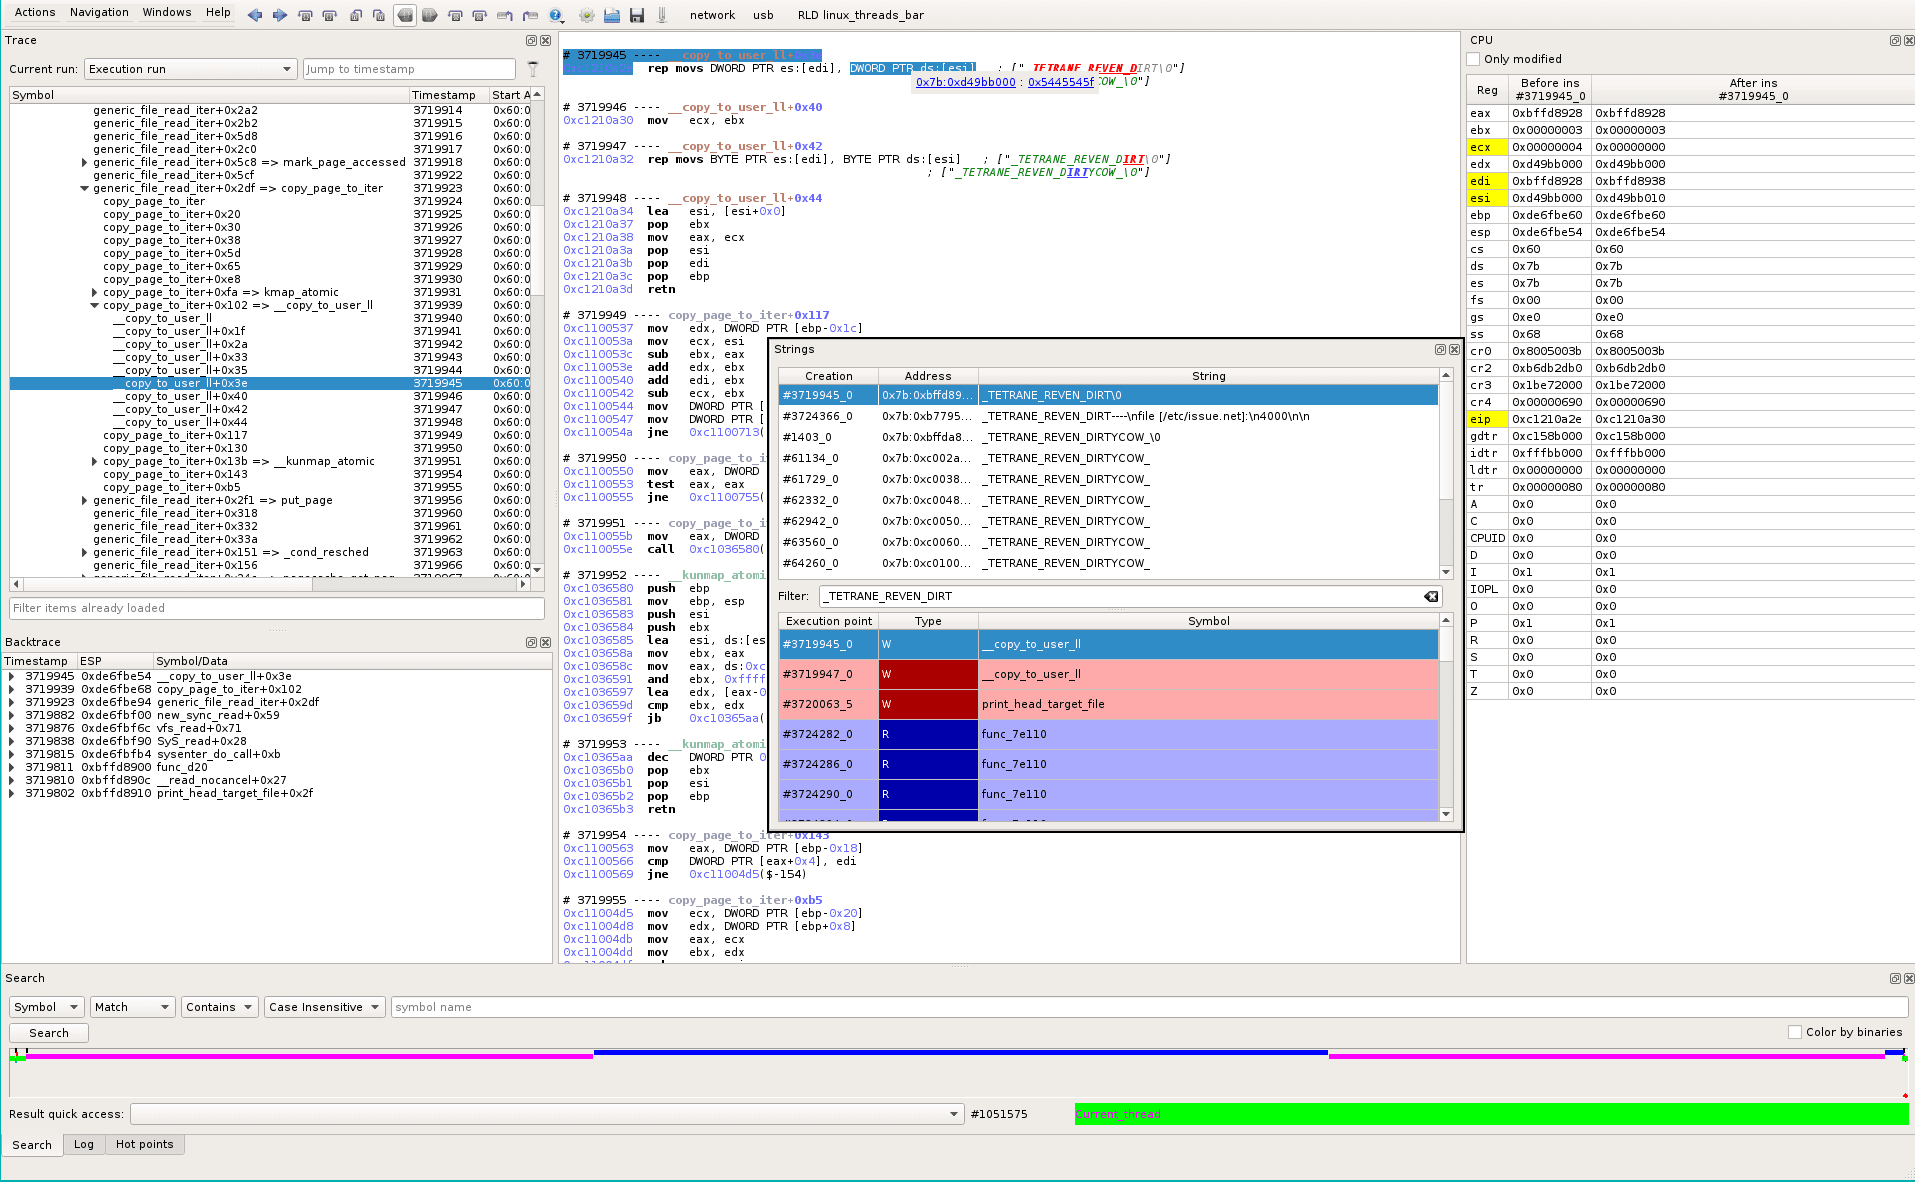
We select the first string access (timestamp #3719945_0), that brings us to the related location in the recorded trace. From the Backtrace widget and the timeline, we derive that this location displays the content of the file at the end of the trace (print_head_target_file() and red dot in timeline).

So we look at the input buffer (ds:[esi]) (see tooltip when selecting the parameter):
It opens a memory dump widget for this pointer, at this trace location:
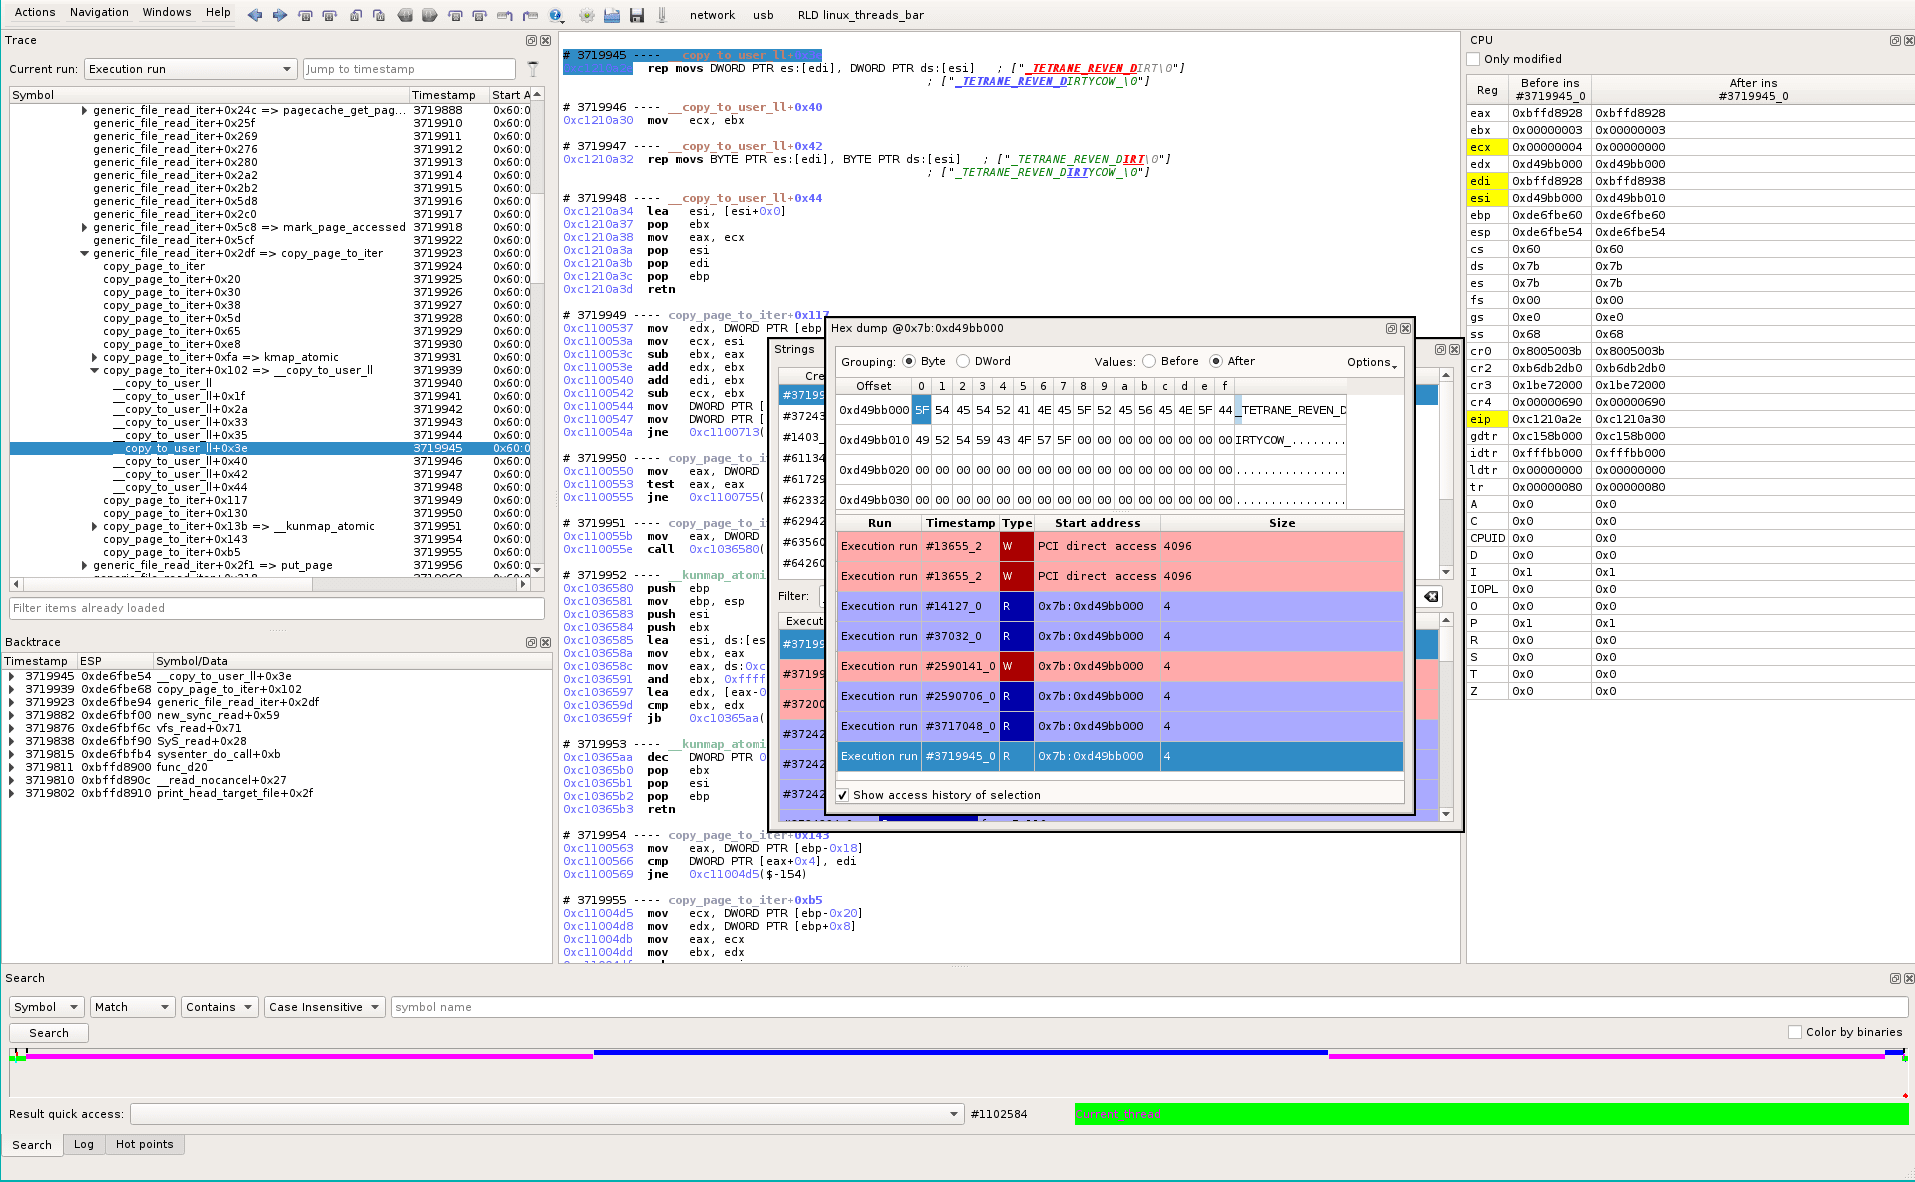
We select the first byte and look at the data history (REVEN-Axion has a database of every memory access for the whole trace). We see that the physical memory pointed to by this virtual address (0x7b:0xd49bb000) is only accessed a few times. First accesses come from a hardware peripheral (“PCI direct access” at early timestamp #13655_2):
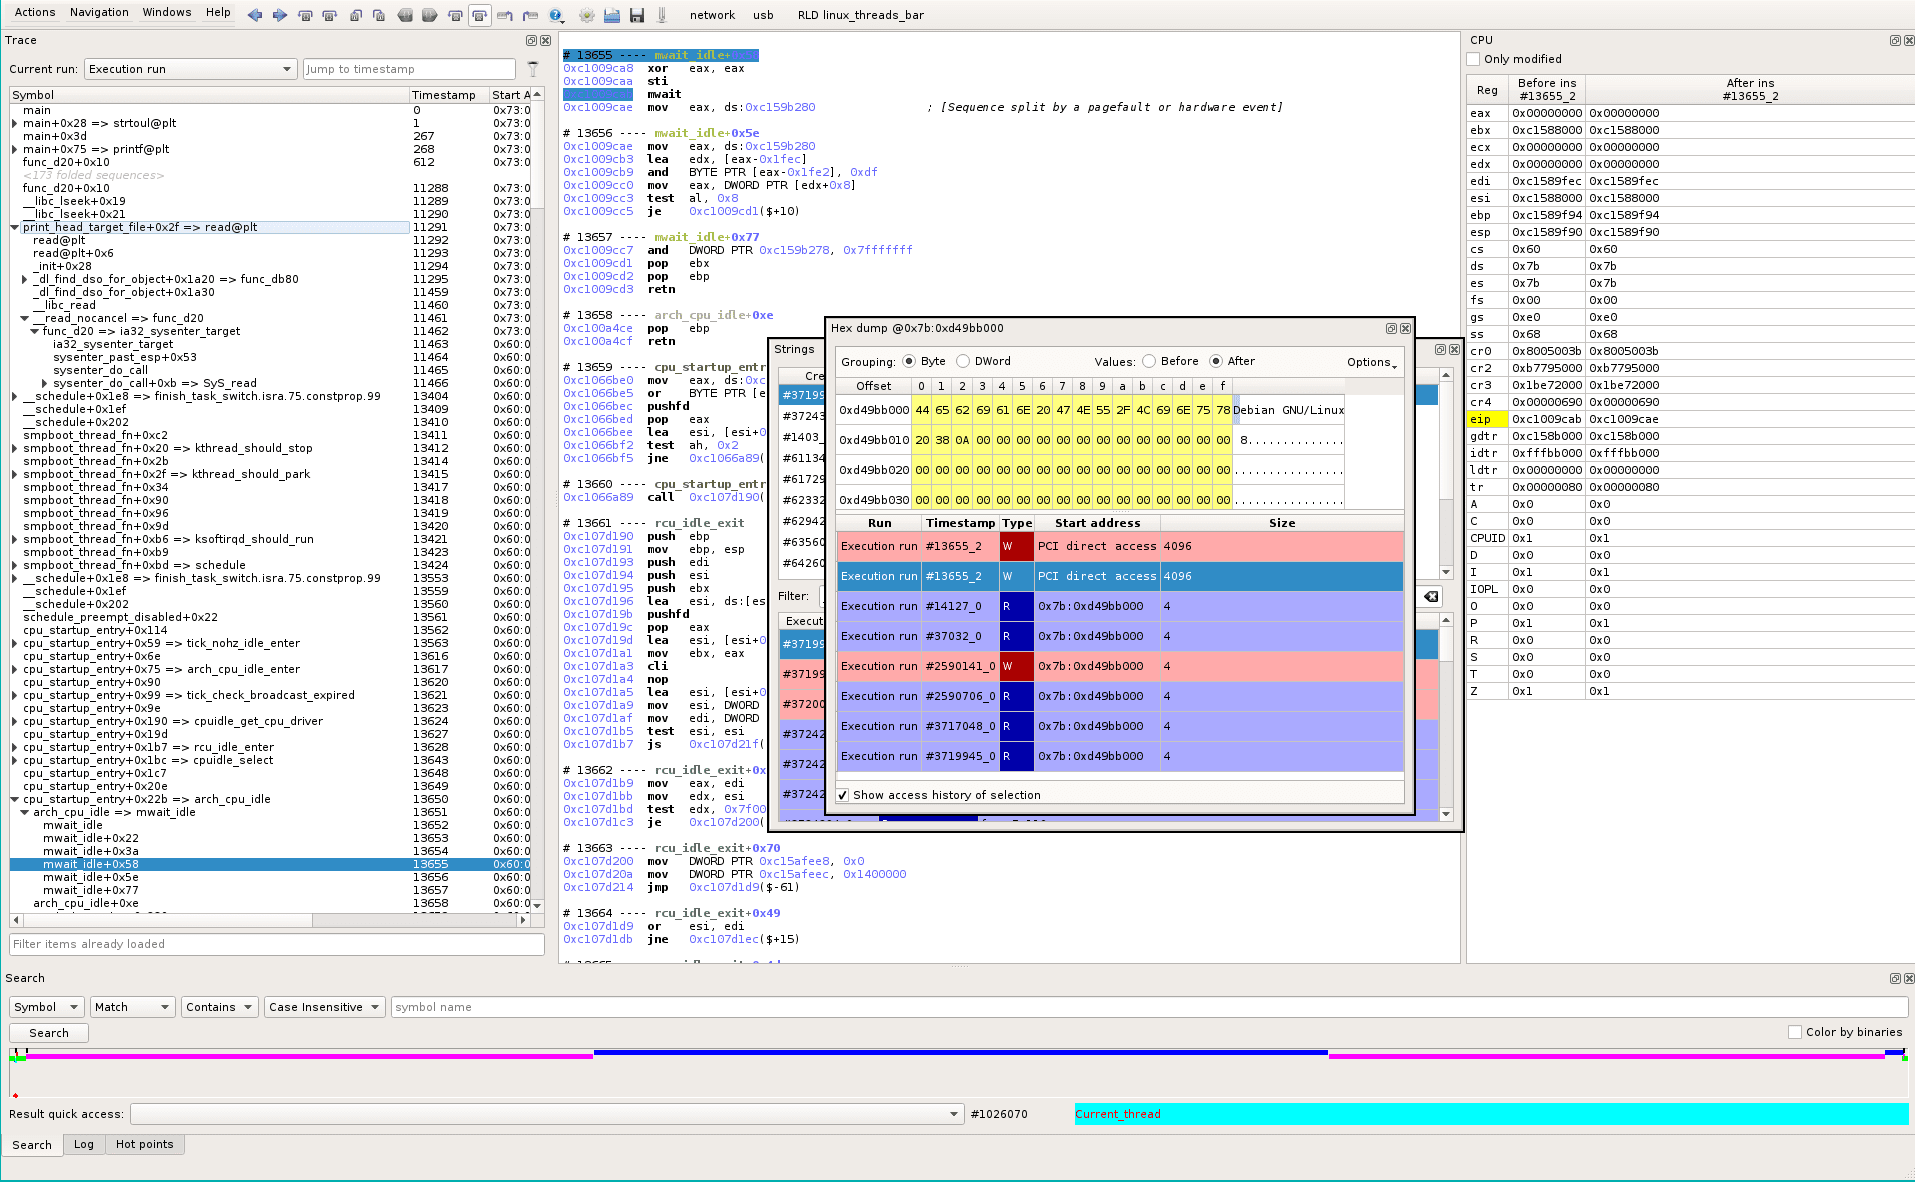
We select the first write in the Data History widget, which brings us to the related trace location. We can see that the write is the first access to disk to read the file (see the content is “Debian GNU/Linux 8”). The main process was waiting for this IO and scheduled an idling process:
But the current topic is not about asynchronous IO in Linux (even though it is very interesting in fact!), let’s keep it for another time ;).
Find the race condition location in the trace
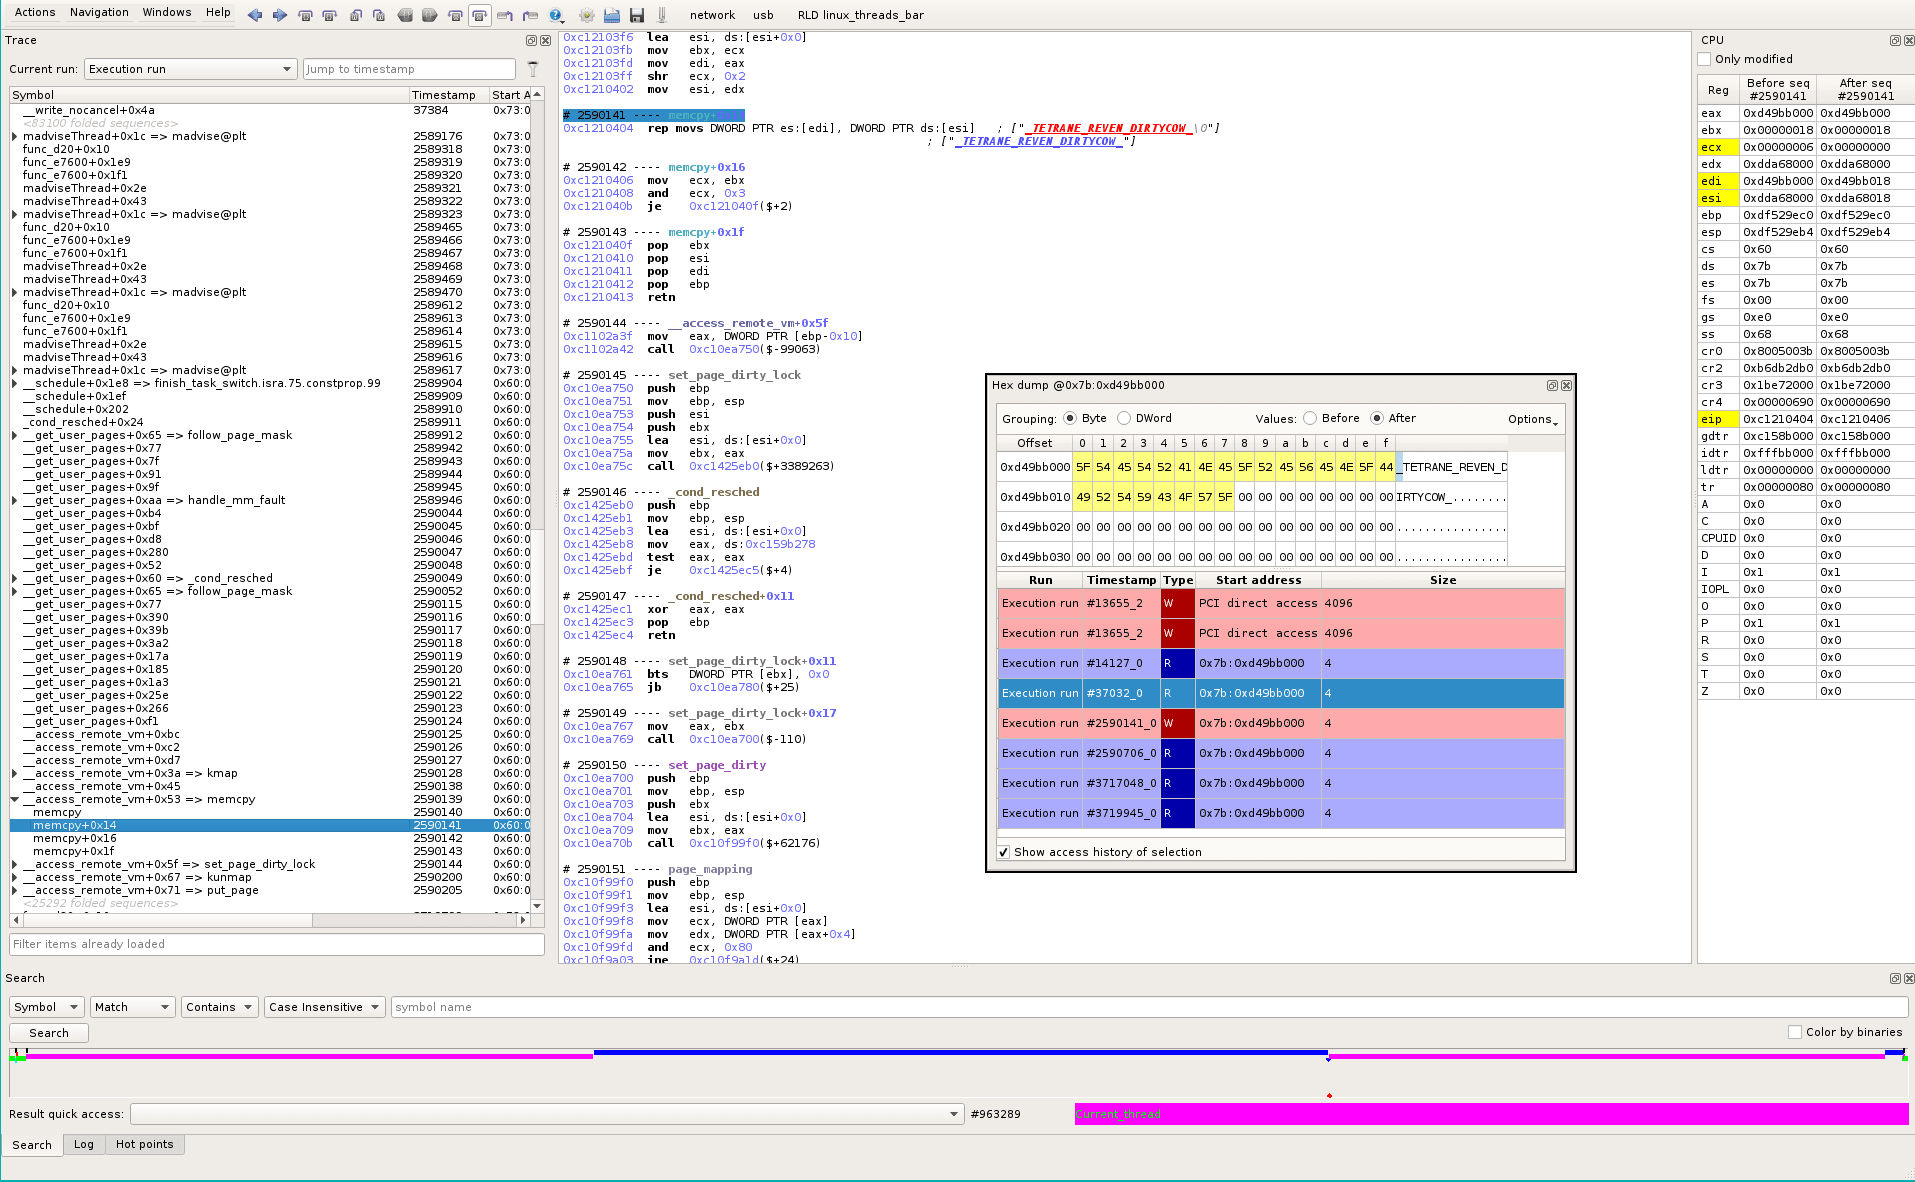
So we know we have here the file kernel cache buffer, located at 0x7b:0xd49bb000. And we see that we’re writing in it at sequence #2590141_0 in the trace. Let’s go there. We see (yellow in the dump) that the current instruction is changing data in our beloved buffer. We can check with the before/after buttons in the Memory dump that we are overwriting the buffer content for the first time. On the left, in the Hierarchical trace, we see that there is a __schedule from madviseThread few timestamps before. At the bottom of the screen, in the timeline, we see the current location (red dot) and we see that we’ve just resumed the magenta thread.
If we go back to where the thread was interrupted, we can see the full backtrace. Axion makes it easy: from the current sequence point, scroll-up, find the end of __get_user_pages (#2590124). Pressing ‘%’ automatically finds the matching “call” of the selected “ret”. It brings us to sequence #1148384 (before the magenta thread was scheduled-out). Here we have the complete backtrace : procselfmemThread->write->mem_write->mem_rw->access_remote_vm->__access_remote_vm
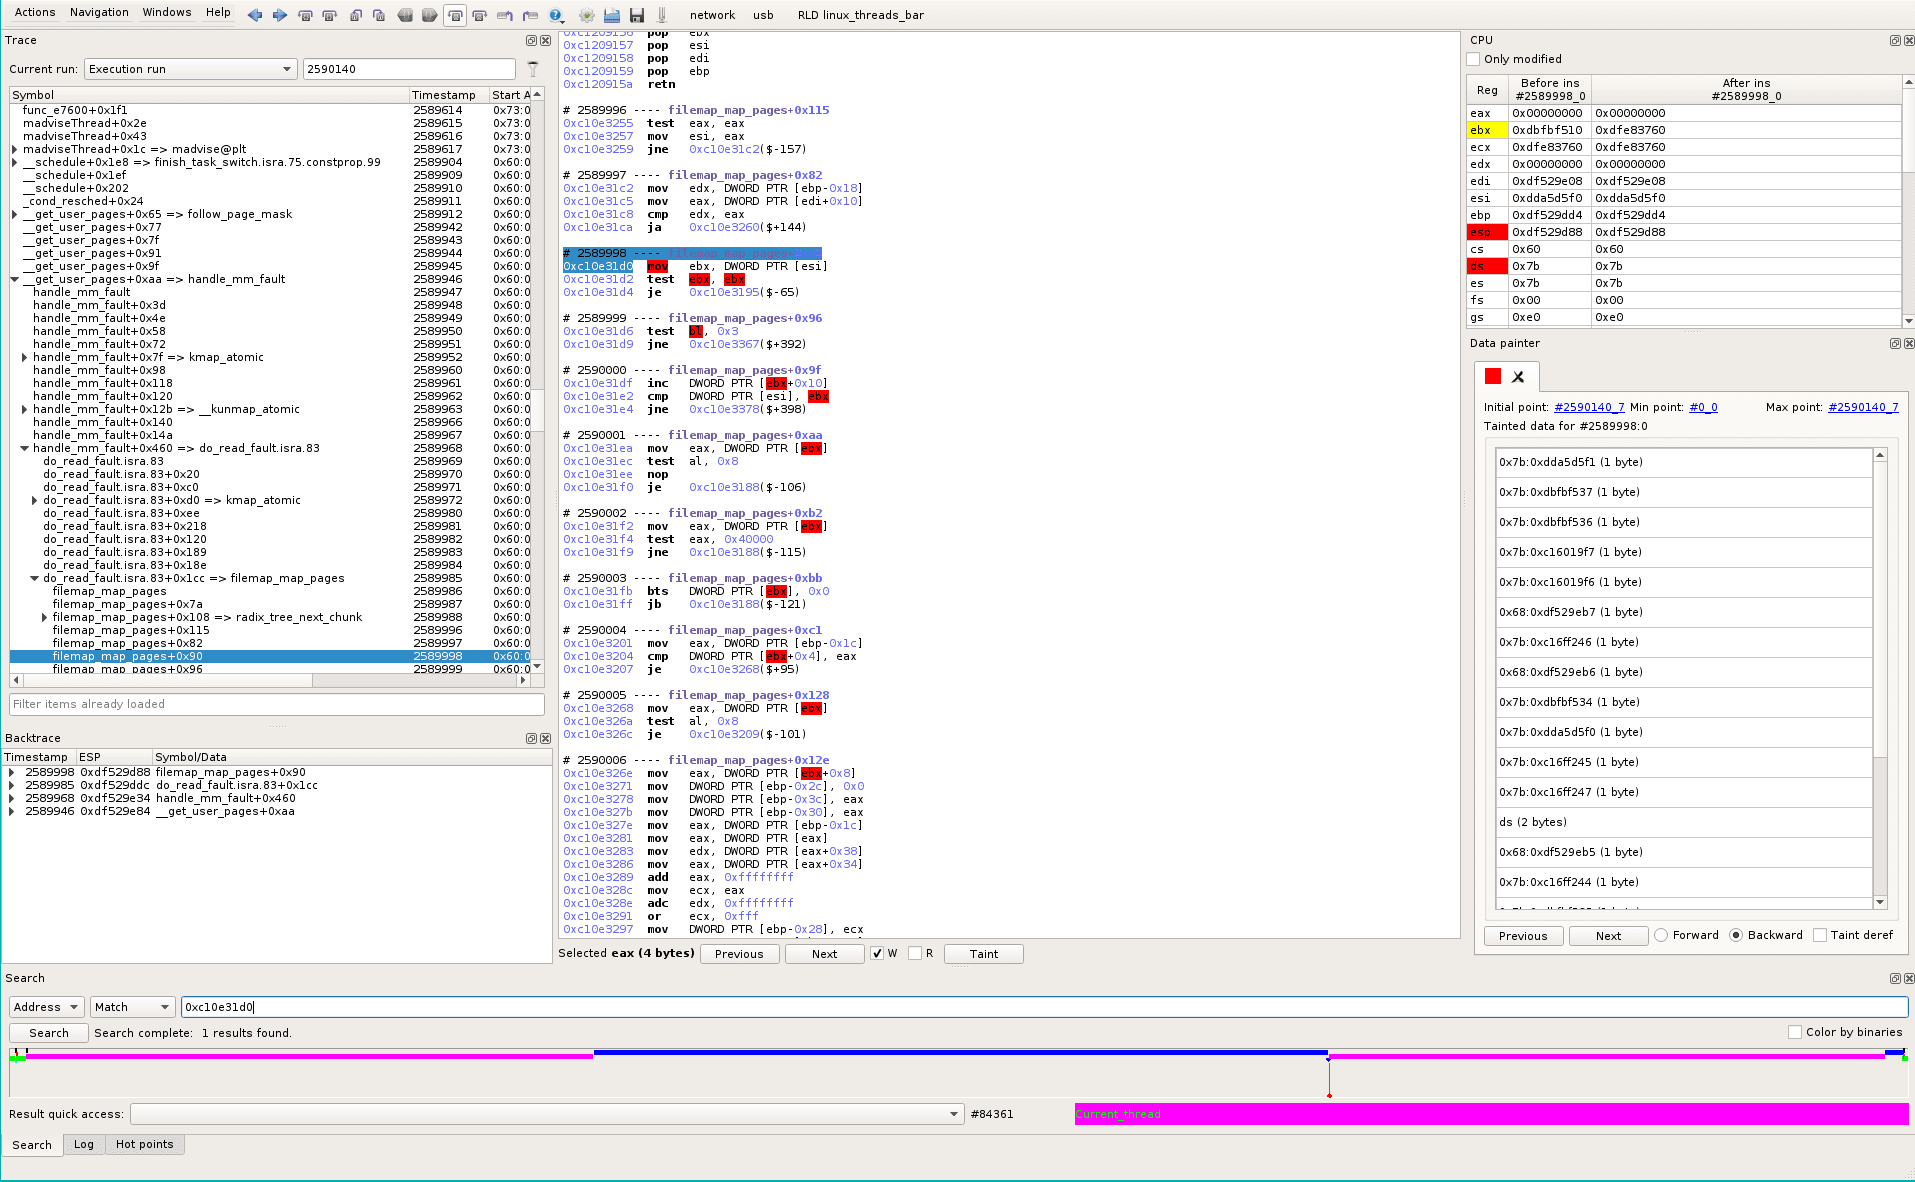
Let’s go back to sequence #2590141 (WRITE point). We want to trace back edi to know where the “faulty” pointer comes from. To avoid overtainting (edi depends also of ecx because of “rep” prefix) scroll-up, at #2590140_7, and select eax.
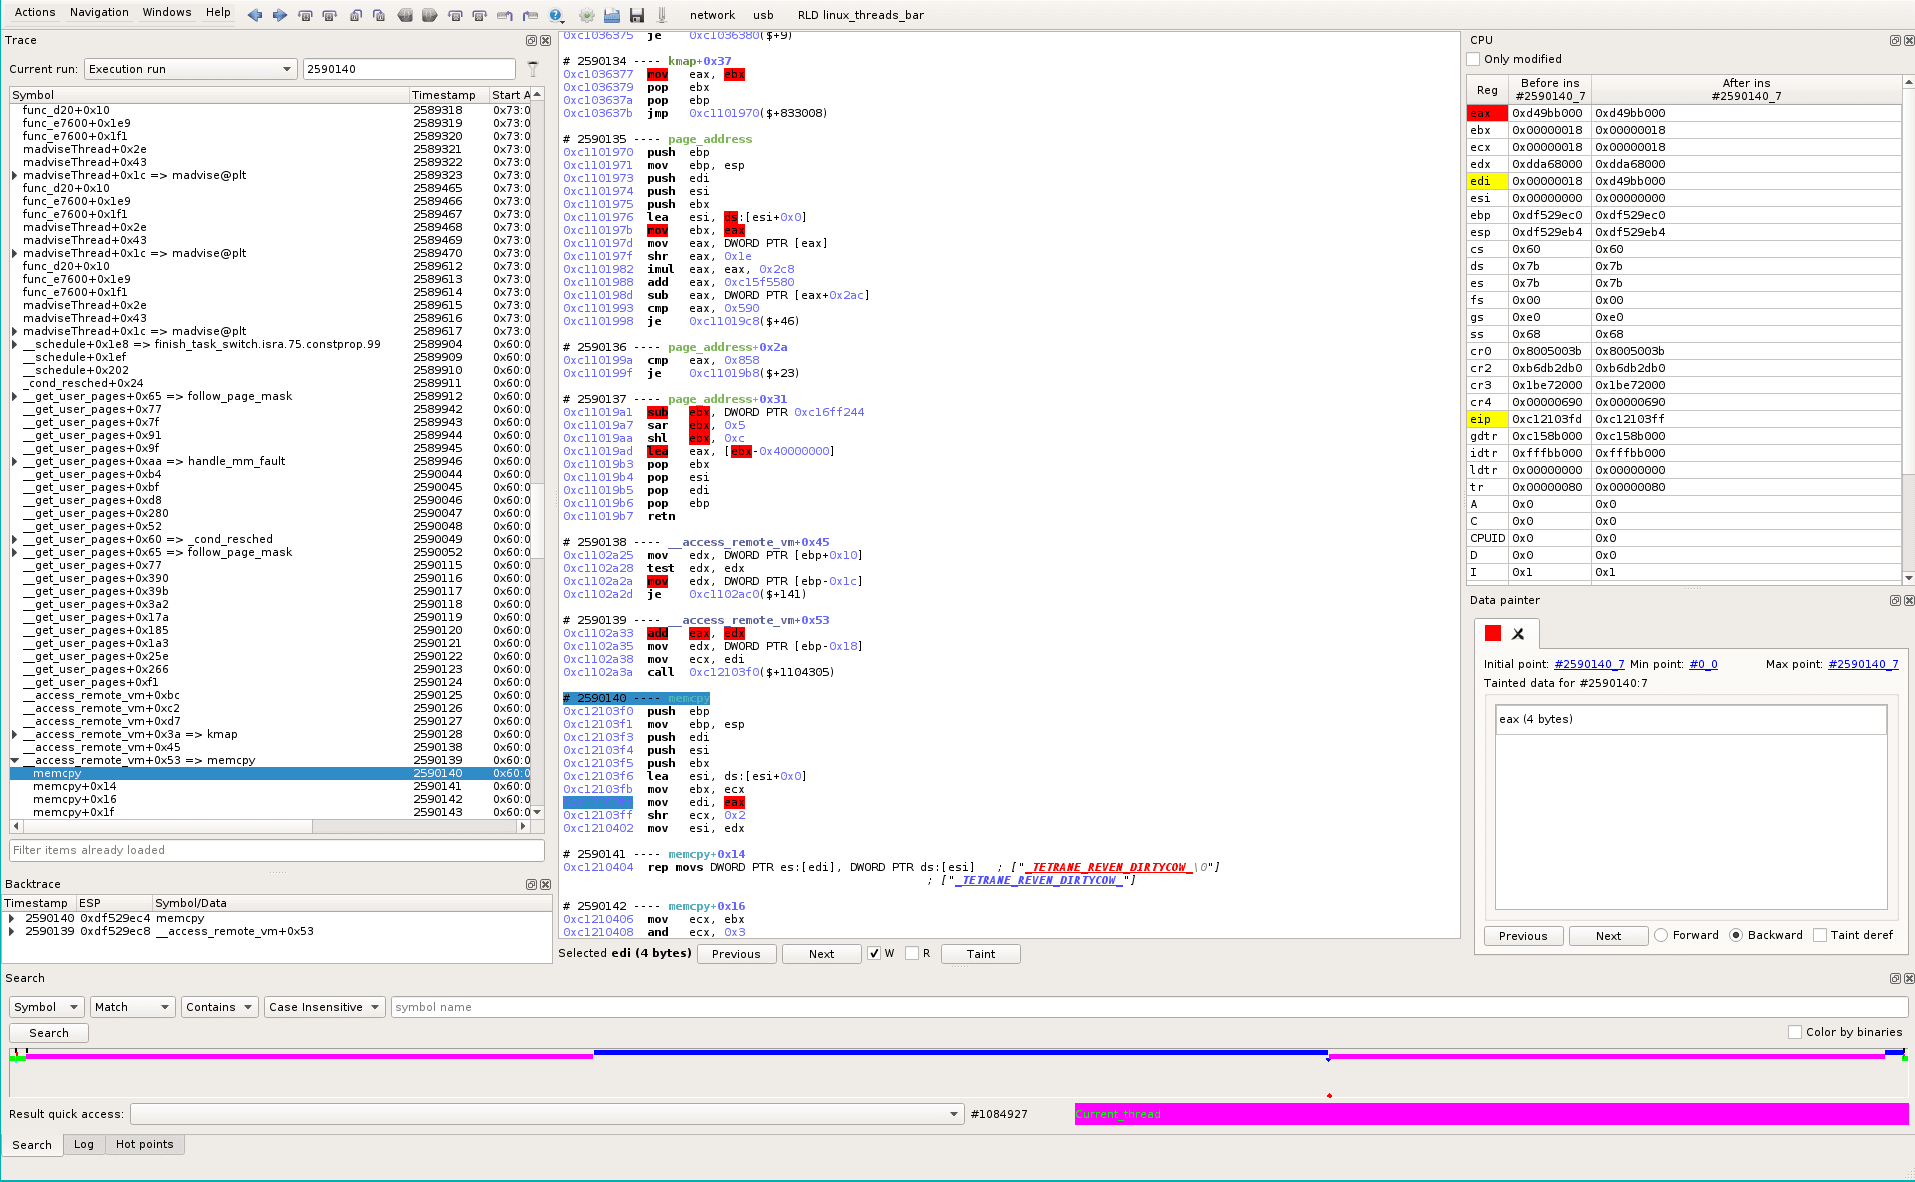
Clicking the Taint button and Backward in the Data Painter pane highlights the backward taint in the trace, which contains too many things when we scroll-up a little. So, from the same start point, we use the Tainter Graph instead (Windows->Miscellaneous->Tainter Graph), that helps to interactively follow the data and discard pointers paths.
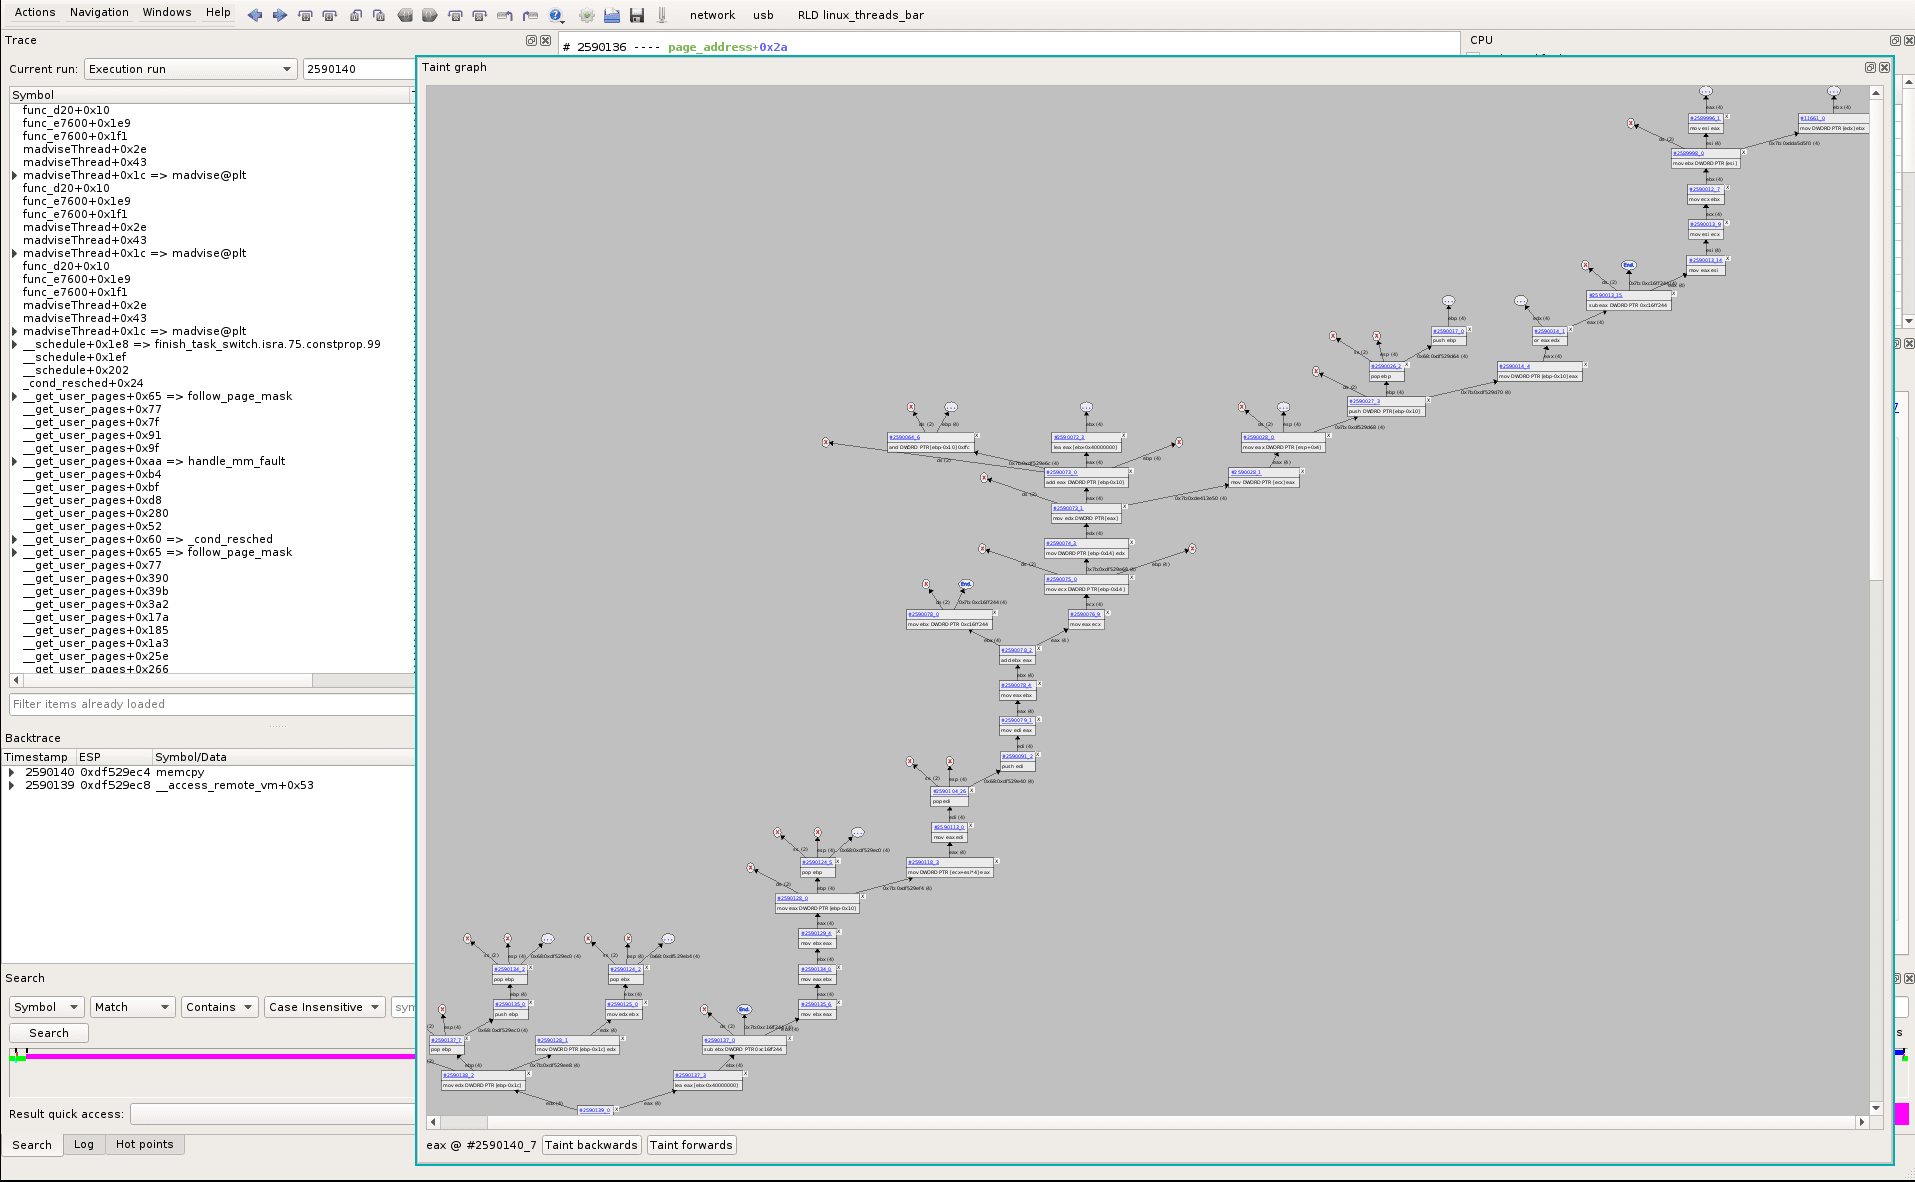
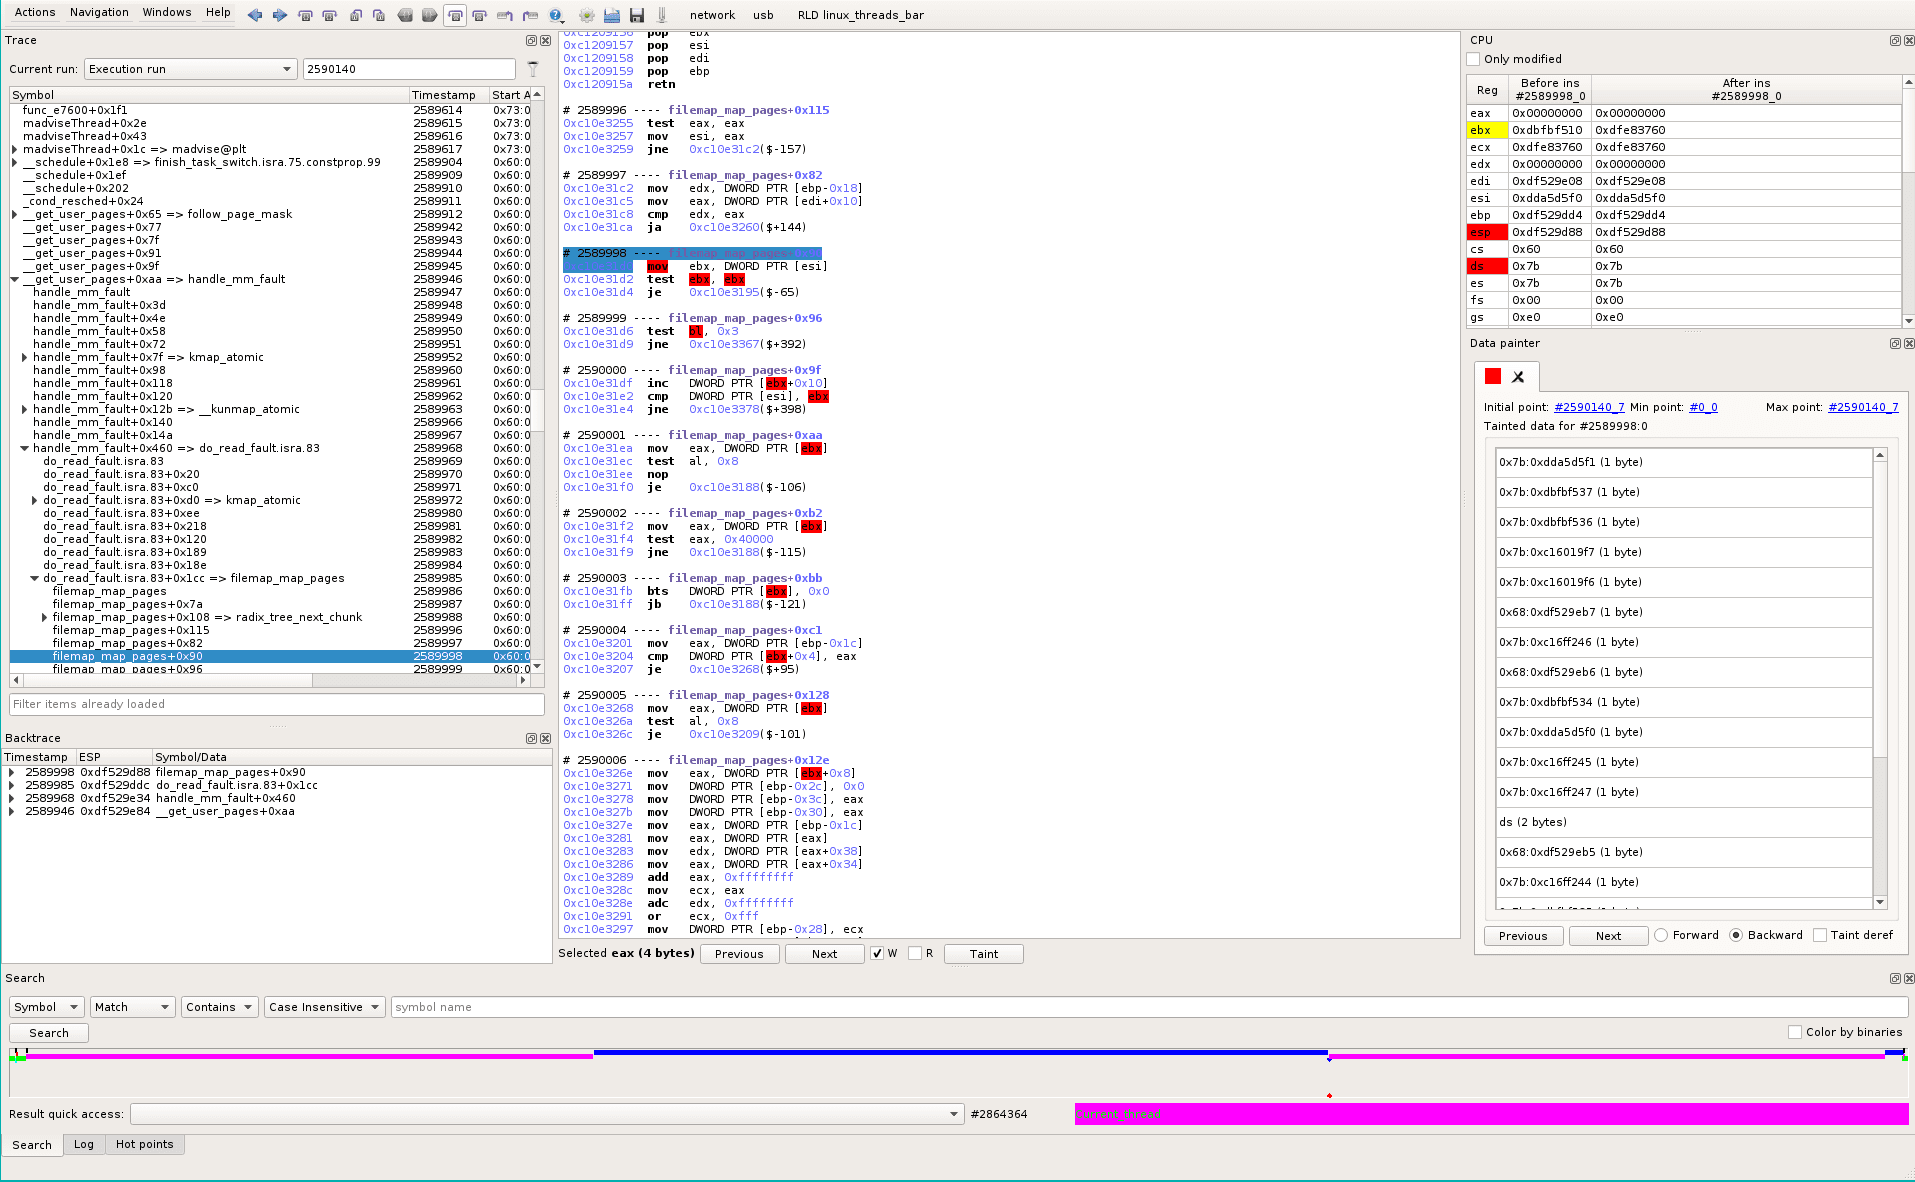
Following data, we go to sequence #258998_0, the last “recent” point before jumping to #11661_0 (which is in the initial read() that loads data from disk, as seen before).
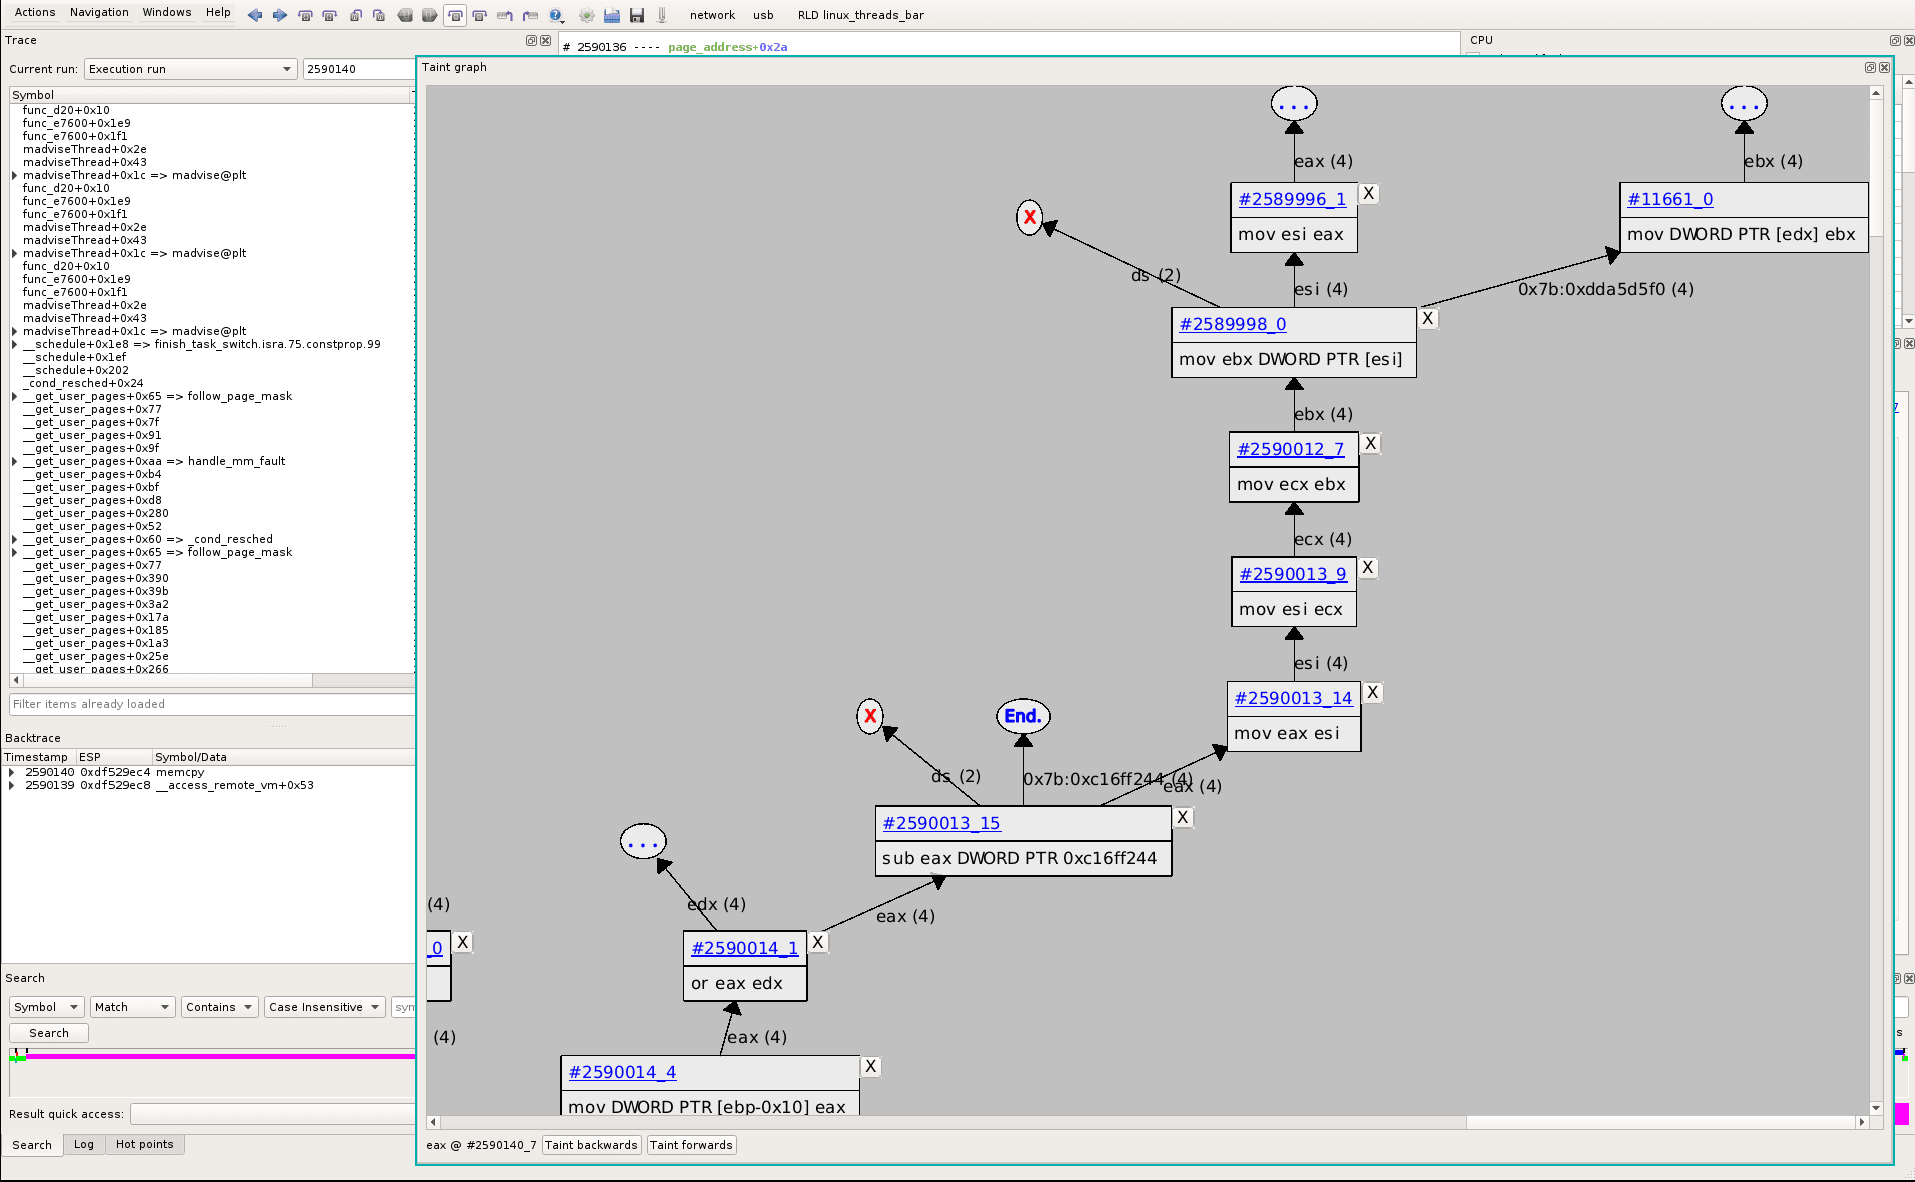
#258998_0 is in filemap_map_pages, backtrace is: __get_user_pages->handle_mm_fault->do_read_fault->filemap_map_pages.
BTW, we find our RED tainted data flow again :)
Unique vs multiple instances
Searching for this eip address (0xc10e31d0) in the trace, we see we only went there once in the whole trace (see in the search widget at the bottom of the screen, search results are shown as vertical bars in the timeline):
Same search for do_read_fault (0xc1105040) returns only one occurence in the trace.
Same search for handle_mm_fault (0xc110561d) returns 4020 occurences in the trace.
-> Cool, it seems a test in there is the cause of the unique behavior we’re investigating \o/
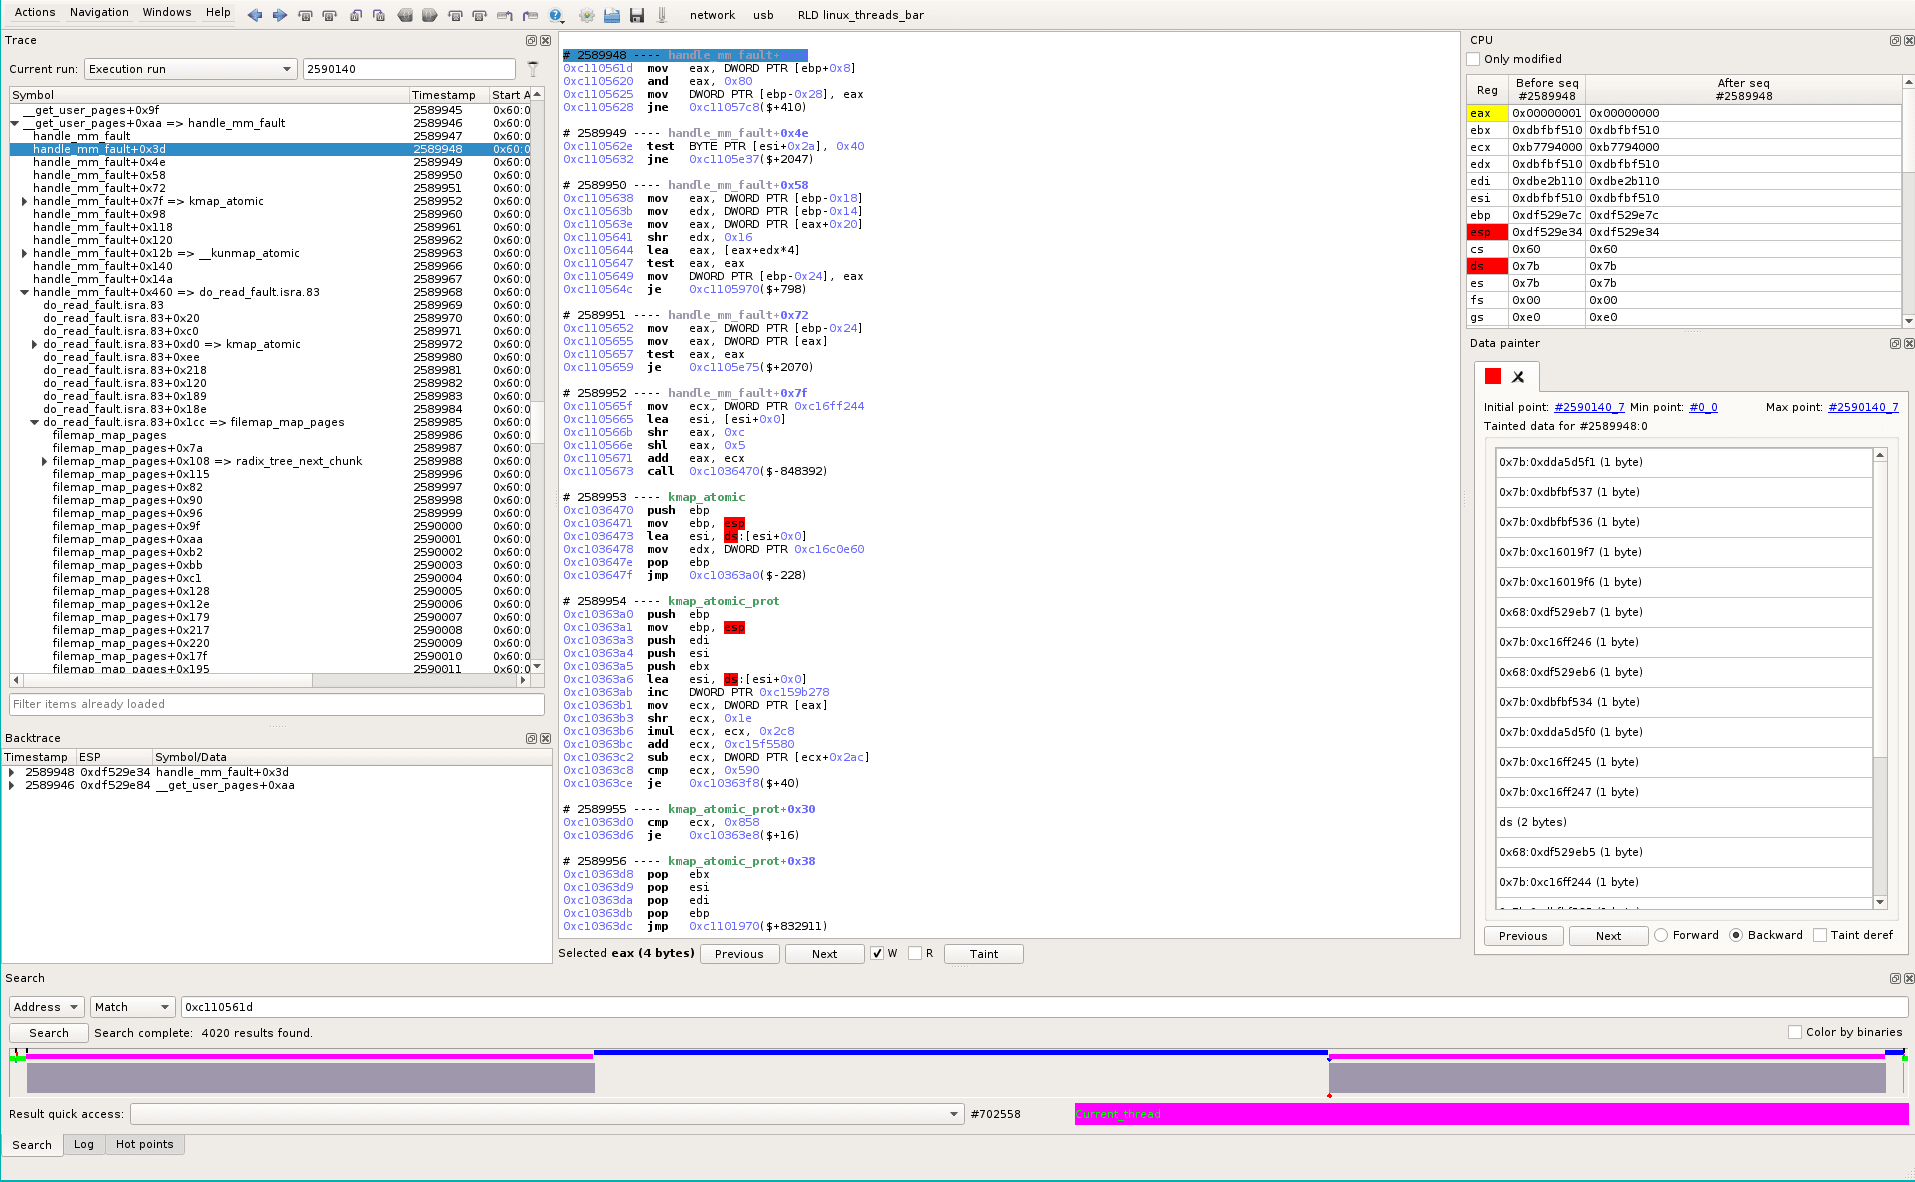
We search for the conditional jump that is only taken once:
search 0xc110572a: 3 results
0xc1105720 idem
0xc110570b idem
0xc11056f8 idem
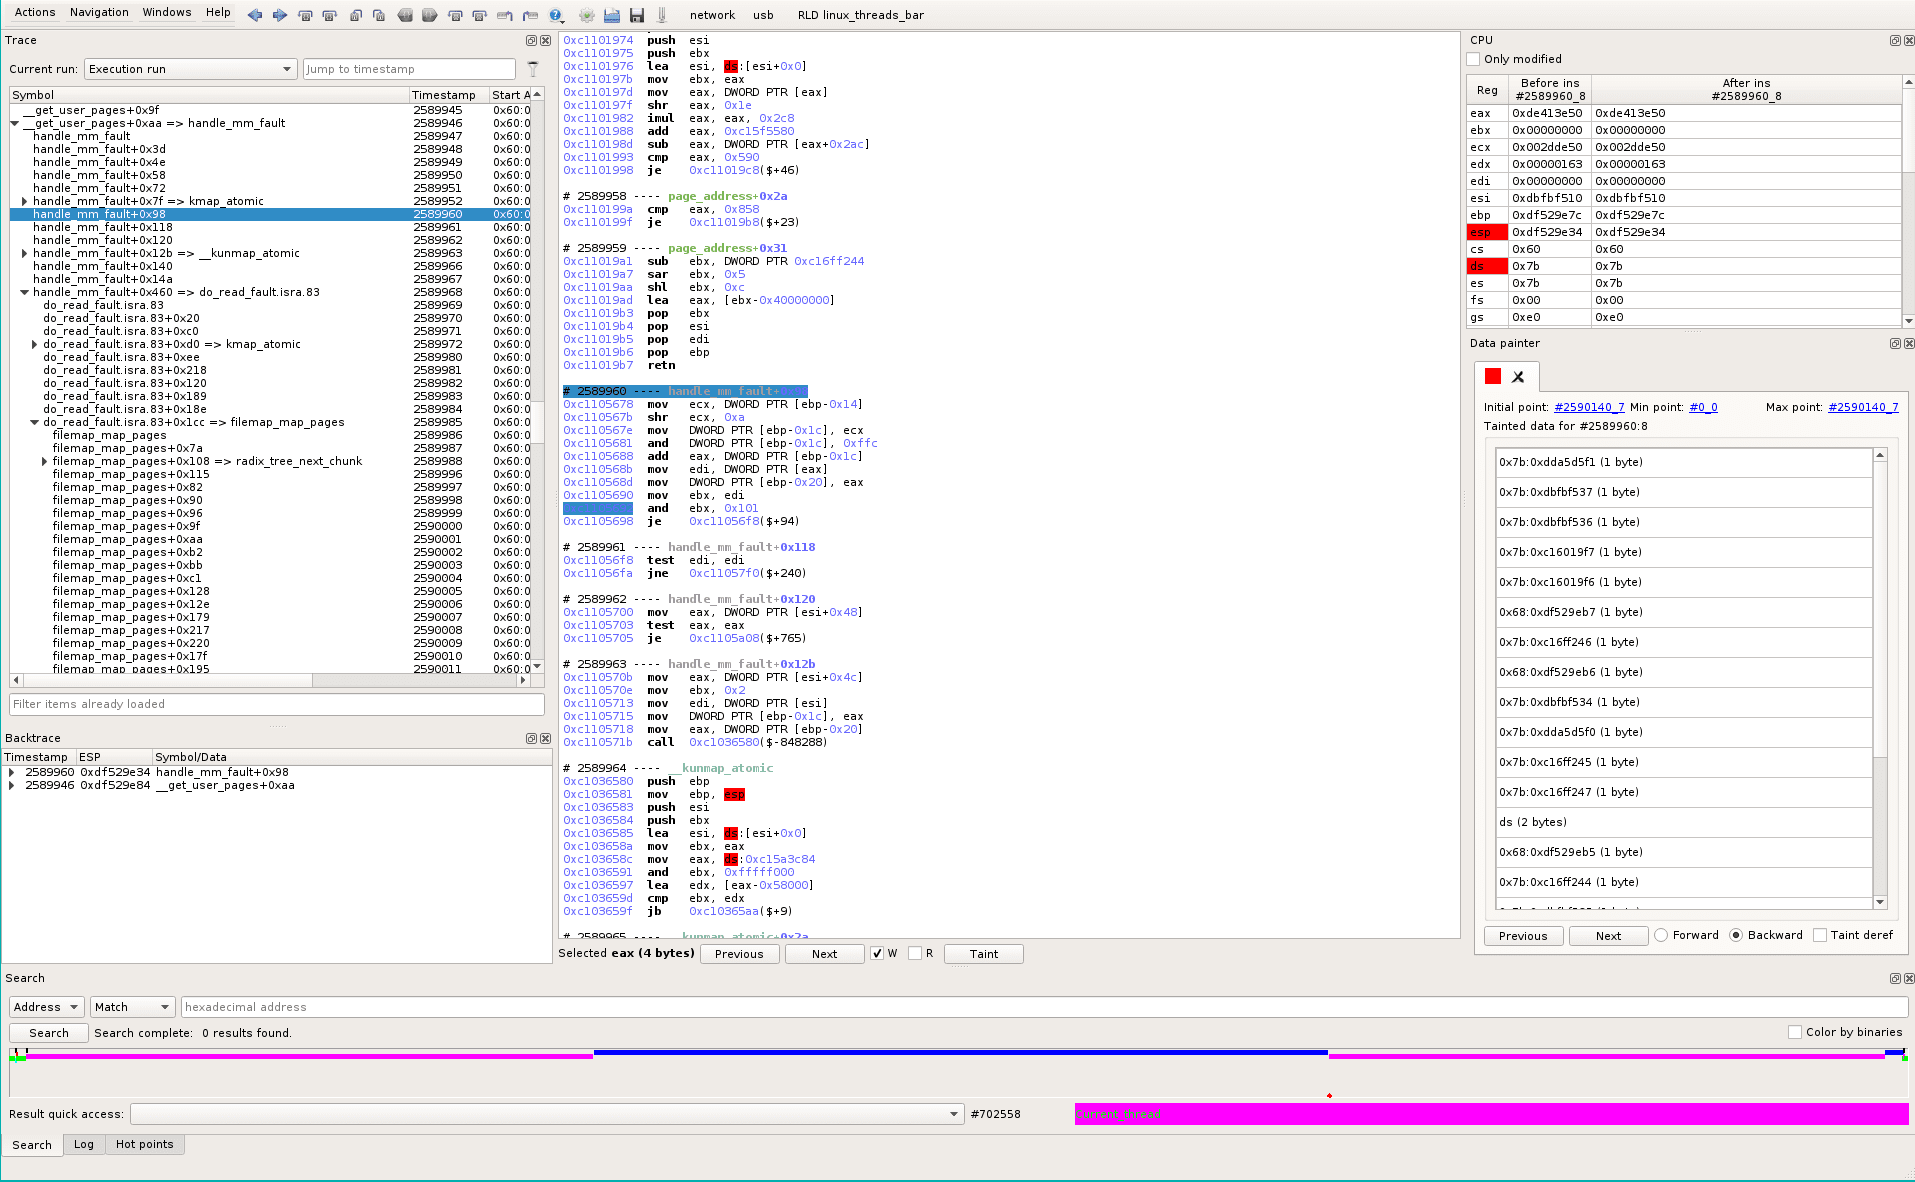
0xc1105678 4020 times -> the condition we’re looking for is at #2589960_9.
0xc1105698 je 0xc11056f8($+94
and the test is just before:
0xc1105692 and ebx, 0x101
So we taint this ebx for backward analysis (see green track).
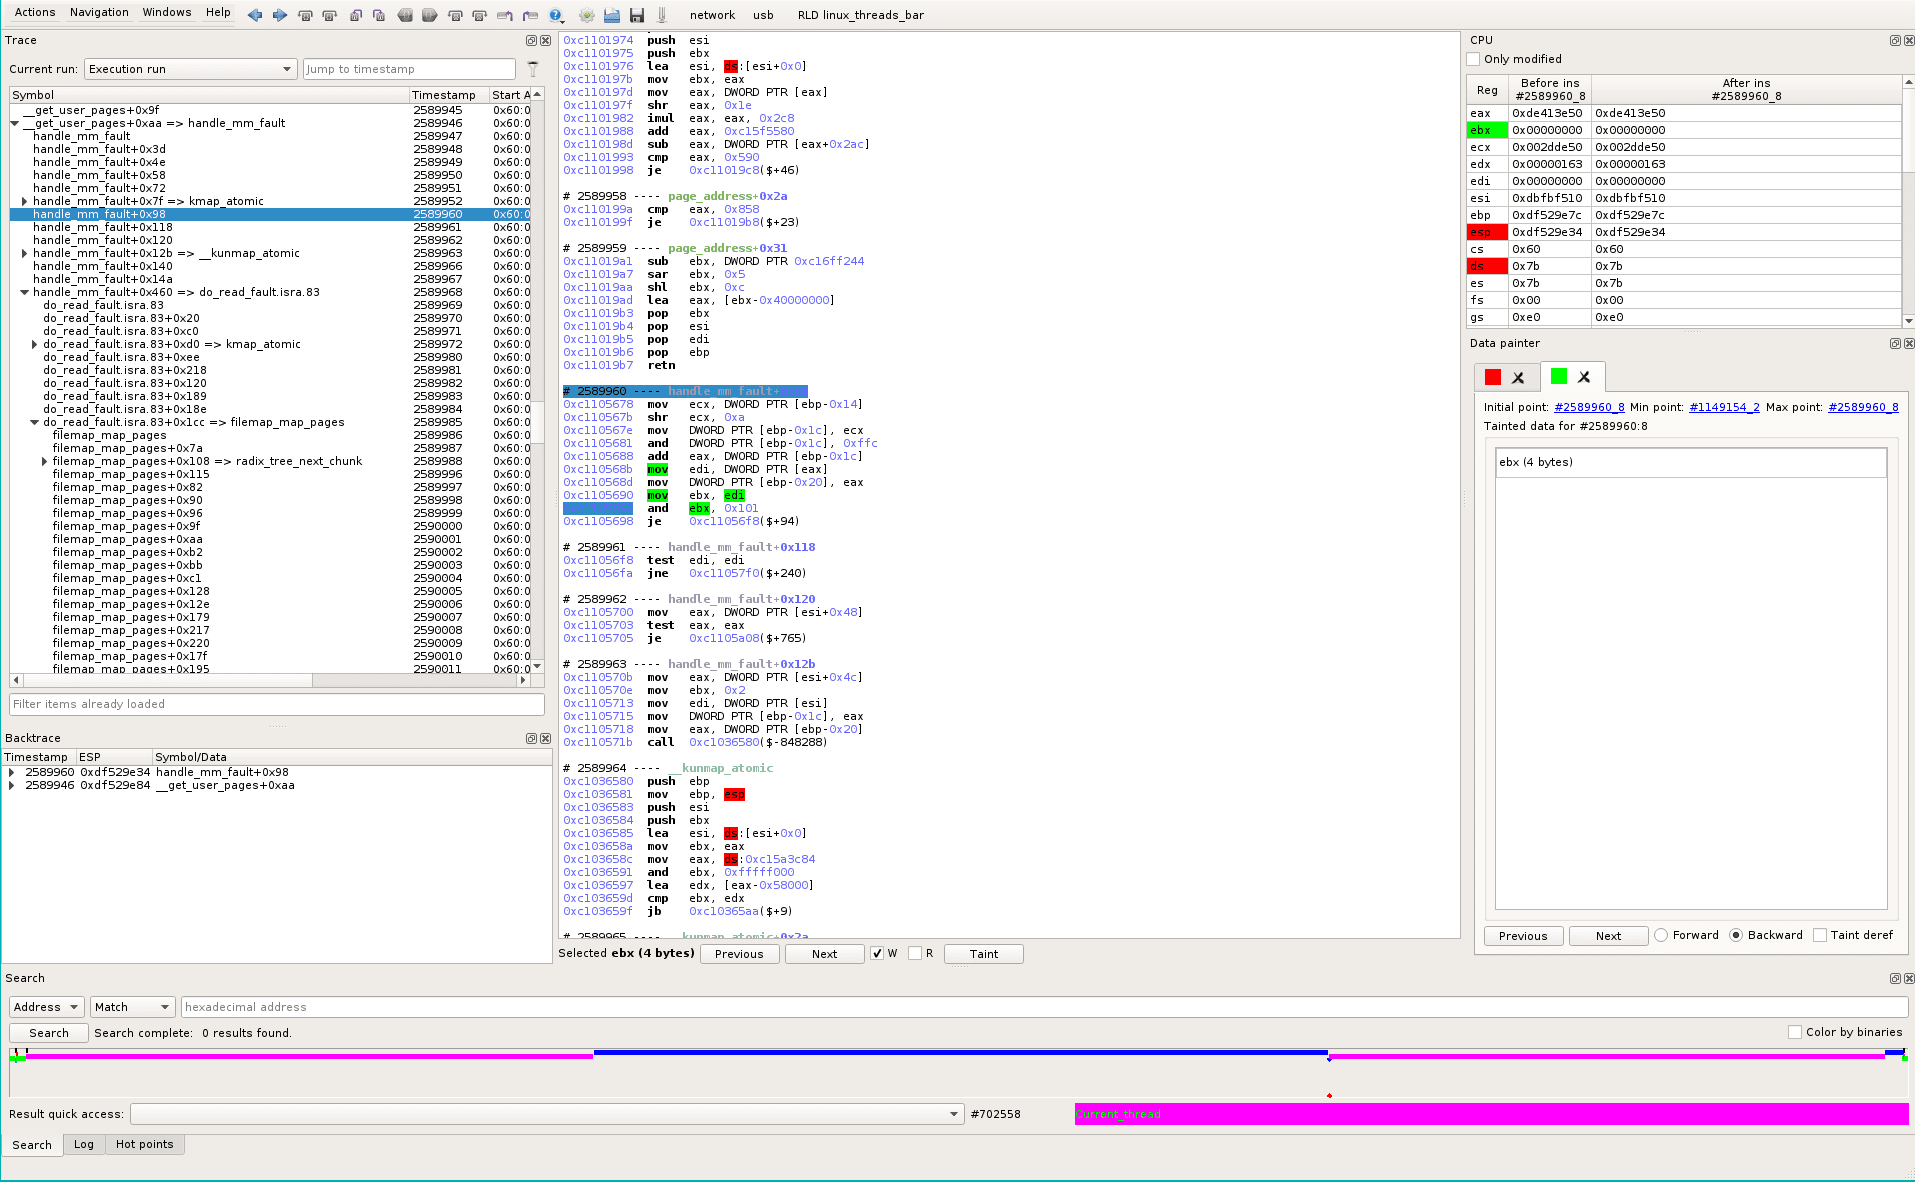
It is straightforward: in the Data Painter widget, green track, click on Min point #1149154_2 that will time-travel when the taint becomes empty. In the assembly view, we see our tainted memory is set to zero at #1149154_3, so the tainter successfully brought us at the right position in time.
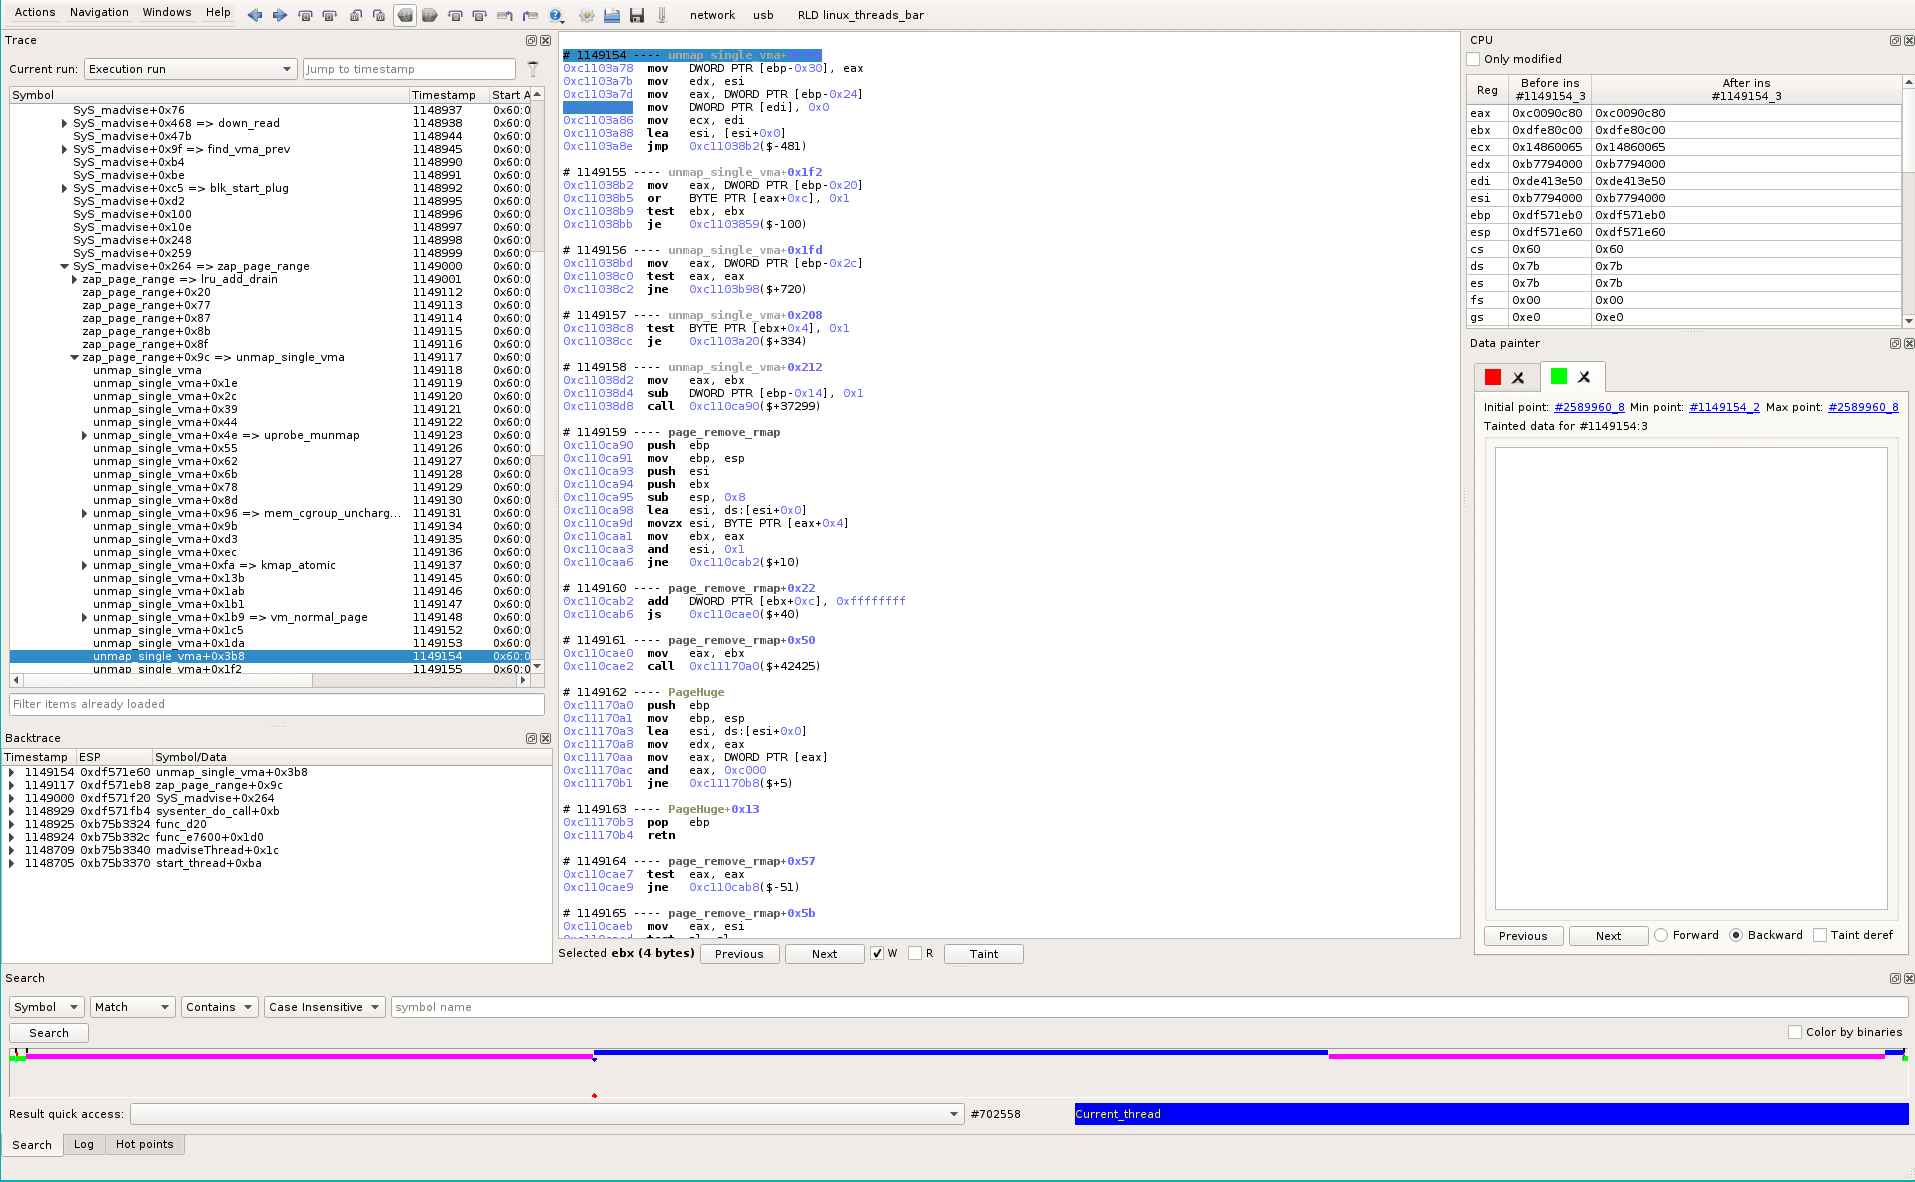
At this point we are in the Blue thread, at the very beginning of the thread, the backtrace is: madviseThread->syscall->zap_page_range->unmap_single_vma
We’ve found that in the magenta thread, a data (at 0x7b:0xde413e50) is written then read. Between the write and the read, the blue thread has overwritten this data at #1149154_3. The data was used by the following instruction that will lead to a conditional jump: should we use the copied buffer (normal case) or the original one (i.e. the real file cache)?
0xc1105692 and ebx, 0x101
So, if we sum up what we have:
- By the end of the trace we display the content of the file.
- This content comes directly from the file-cache buffer.
- Thanks to data-accesses history, we directly see where this data was written in the magenta thread (the one that always tries to write the ReadOnly file).
- It was just after interruption by the blue thread (the thread that always says we can un-map the virtual space range that maps the ReadOnly file).
- We quickly identify what portion of code is executed only for the ‘faulty’ write.
- We identify the condition in code that causes the execution flow to go to this path.
- We track back the checked data and see it was written by the blue thread, so we identified the “race condition”: some data is written in a thread and leads the other thread to a bug.
Match with Linux sources
(Please note that this is easy to show live, but trickier to explain in screenshots/text. This article is already too long, so here is the fast summary :) )
We use the esReven static vision of the dynamic execution to see statically what was executed around our interesting code.
0xc1105692 and ebx, 0x101
0xc1105698 je 0xc11056f8($+94
A cool feature is that when you move your mouse over the trace, the graph highlights its related blocks. So you can follow interactively the dynamic code under your mouse in the static view. In this view, only code that is executed at less once in the trace is displayed. So you are not polluted by code you don’t want to see.
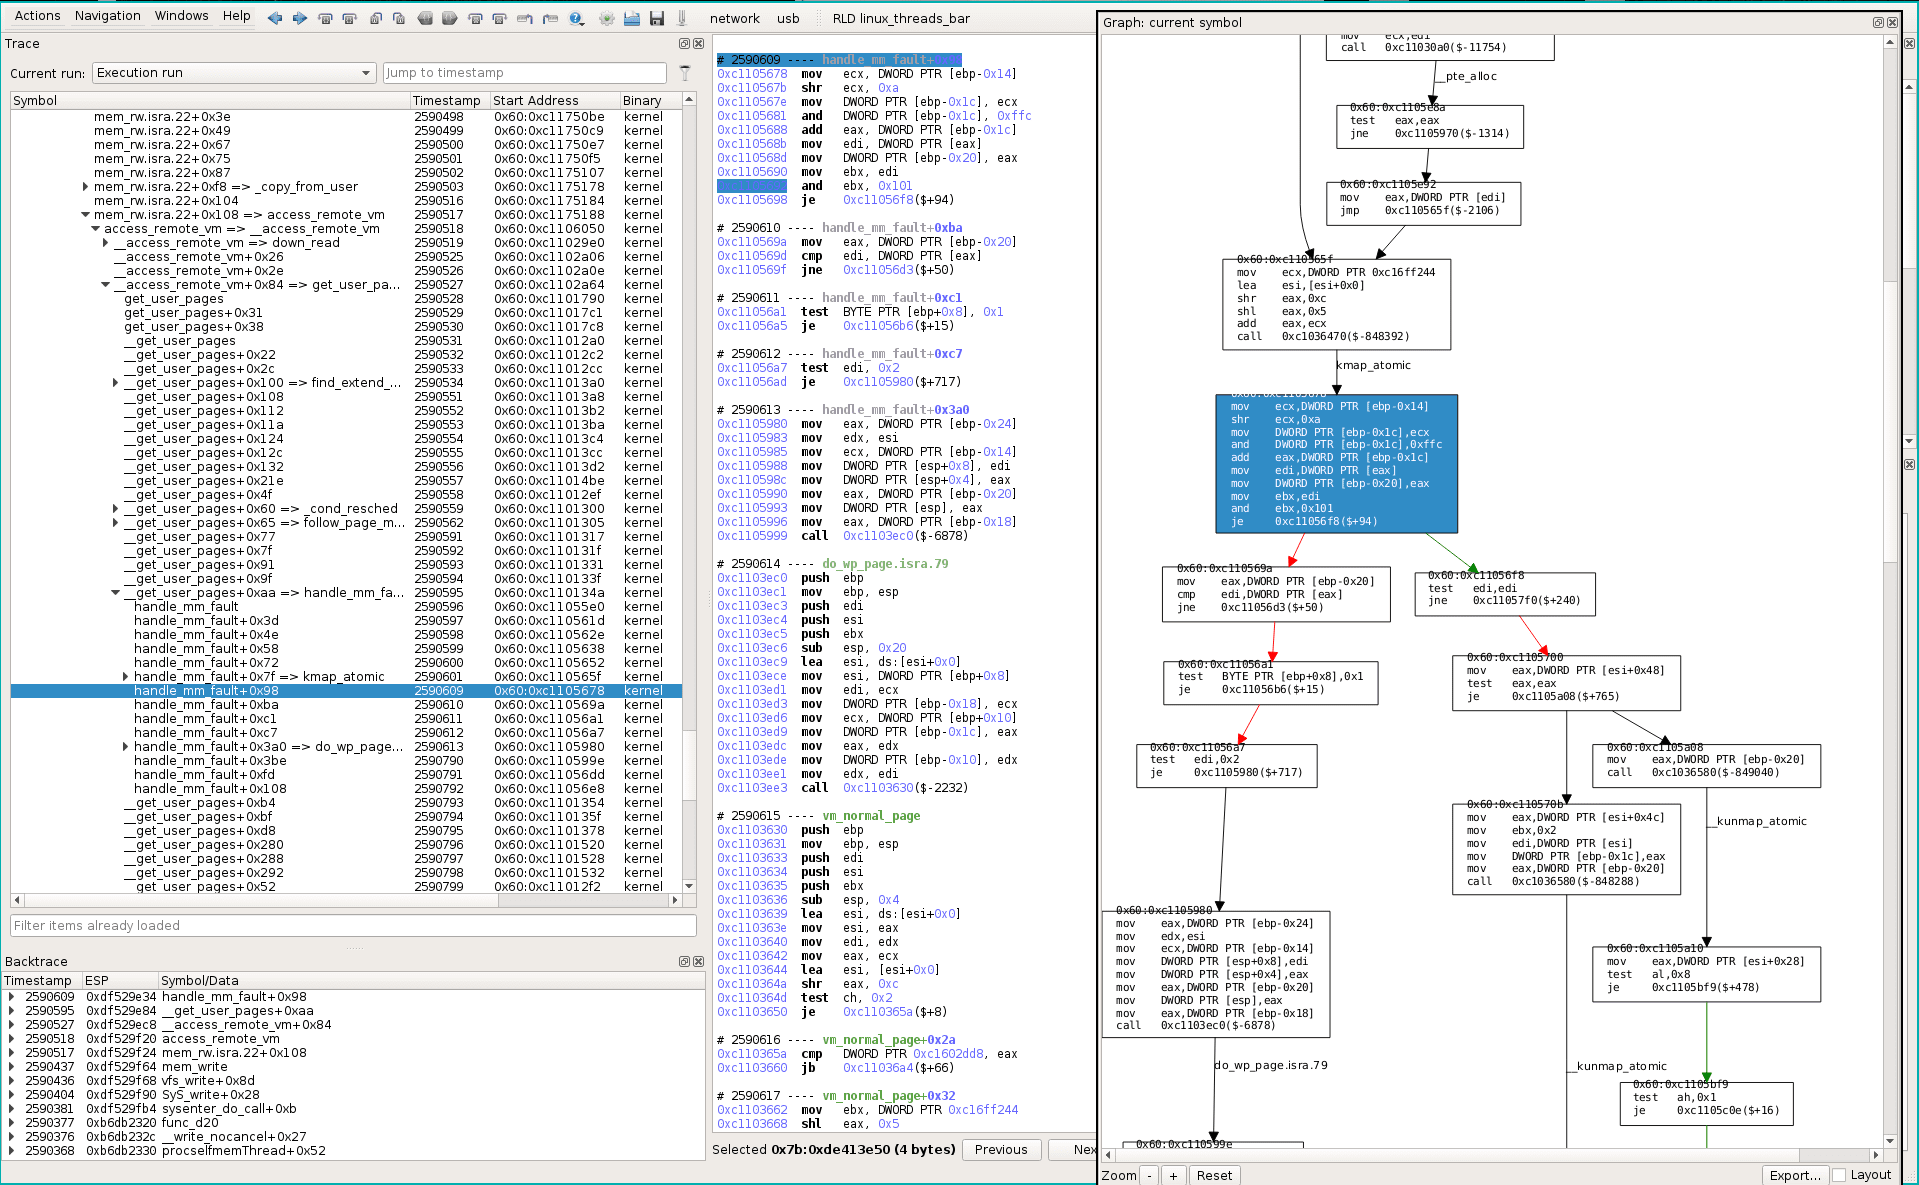
Now, a very quick comparison of Linux source code (some greps with symbols found in the static graph) and executed binaries makes us discover the matching line in Linux => mm/memory.c:3199 if (!pte_present(entry))
Which expands to (pte_flags(entry) & (_PAGE_PRESENT | _PAGE_PROTNONE)). And browsing linux sources, we see _PAGE_PRESENT=0x1, _PAGE_PROTNONE=0x100, so the 0x101 in assembly.
(a lot of functions are inlined, so the matching require some linux kernel habits ;) )
3191 static int handle_pte_fault(struct mm_struct *mm,
3192          struct vm_area_struct *vma, unsigned long address,
3193          pte_t *pte, pmd_t *pmd, unsigned int flags)
3194 {
3195   pte_t entry;
3196   spinlock_t *ptl;
3197
3198   entry = *pte;
3199   if (!pte_present(entry)) {
3200     if (pte_none(entry)) {
3201       if (vma->vm_ops)
3202         return do_linear_fault(mm, vma, address,
3203             pte, pmd, flags, entry);
3204
3205       return do_anonymous_page(mm, vma, address,
3206              pte, pmd, flags);
3207     }
3208     if (pte_file(entry))
3209       return do_nonlinear_fault(mm, vma, address,
3210           pte, pmd, flags, entry);
3211     return do_swap_page(mm, vma, address,
3212           pte, pmd, flags, entry);
3213   }
3214
3215   if (pte_numa(entry))
3216     return do_numa_page(mm, vma, address, entry, pte, pmd);
3217
3218   ptl = pte_lockptr(mm, pmd);
3219   spin_lock(ptl);
3220   if (unlikely(!pte_same(*pte, entry)))
3221     goto unlock;
3222   if (flags & FAULT_FLAG_WRITE) {
3223     if (!pte_write(entry))
3224       return do_wp_page(mm, vma, address,
3225           pte, pmd, ptl, entry);
3226     entry = pte_mkdirty(entry);
3227   }
In esReven, we have tainted ebx backward, saw that it is reset by madvise(), which overrides value initially set by the first do_cow_fault. Flags value was 0x65 then.
With 0x65 instead of 0x0, the ebx&0x101 (i.e. pte_present(entry)) would have returned true, and we would have taken the do_wp_page() (write-protection fault, that would have copied the page as usual) instead of the do_linear_fault() (that gives access to page containing the file cache buffer).
Now we have the full vision of the kernel bug exploited by the user-space POC.
Conclusion
Using esReven and the Axion GUI on a kernel race-condition case has proven to be quite useful, as its non-intrusive way of working doesn’t alter the analyzed system behavior. It allows an analyst to quickly browse the execution trace from the end to the beginning (time-travel and backward analysis). Thanks to Axion unique features, the analyst can then find points of interest and understand what is going on.
Using esReven and Axion, an experienced user with strong low-level skills can reverse such a trace in about 7 minutes.


