


ALL-IN-ONE PLATFORM
esDynamic
Manage your attack workflows in a powerful and collaborative platform.
Expertise Modules
Executable catalog of attacks and techniques.
Infrastructure
Integrate your lab equipment and remotely manage your bench.
Lab equipments
Upgrade your lab with the latest hardware technologies.


PHYSICAL ATTACKS
Side Channel Attacks
Evaluate cryptography algorithms from data acquitition to result visualisation.
Fault Injection Attacks
Laser, Electromagnetic or Glitch to exploit a physical disruption.
Security Failure Analysis
Explore photoemission and thermal laser stimulation techniques.


EXPERTISE SERVICES
Evaluation Lab
Our team is ready to provide expert analysis of your hardware.
Starter Kits
Build know-how via built-in use cases developed on modern chips.
Cybersecurity Training
Grow expertise with hands-on training modules guided by a coach.


ALL-IN-ONE PLATFORM
esReverse
Static, dynamic and stress testing in a powerful and collaborative platform.
Extension: Intel x86, x64
Dynamic analyses for x86/x64 binaries with dedicated emulation frameworks.
Extension: ARM 32, 64
Dynamic analyses for ARM binaries with dedicated emulation frameworks.
DIFFERENT USAGES
Penetration Testing
Identify and exploit system vulnerabilities in a single platform.
Vulnerability Research
Uncover and address security gaps faster and more efficiently.
Malevolent Code Analysis
Effectively detect and neutralise harmful software.
Digital Forensics
Collaboratively analyse data to ensure thorough investigation.


EXPERTISE SERVICES
Software Assessment
Our team is ready to provide expert analysis of your binary code.
Cybersecurity training
Grow expertise with hands-on training modules guided by a coach.

INDUSTRIES
Semiconductor
Security Labs
Governmental agencies
Academics

ABOUT US
Why eShard?
Our team
Careers


FOLLOW US
Linkedin
Twitter
Youtube
Gitlab
Github


Automatic post-fuzzing triage and automation using esReven

As those of you lucky enough to attend the great OffensiveCon 2022 might be aware, we are developing a Fuzzing & Triage platform based off esReven Enterprise Edition.
The platform aims at automating root cause analysis by deriving advanced information about crashes found by a fuzzer, such as the origin of the crash (which bytes from the input files are directly causing the crash), the underlying vulnerability (buffer overflow, use-after-free…) and the coverage information for the crash.
The platform comes with a visualizer to display a report for each crash, with the ability to open the corresponding scenario for analysis with Axion (esReven’s GUI).
How it works
The way the platform works can be summarized with the following diagram:
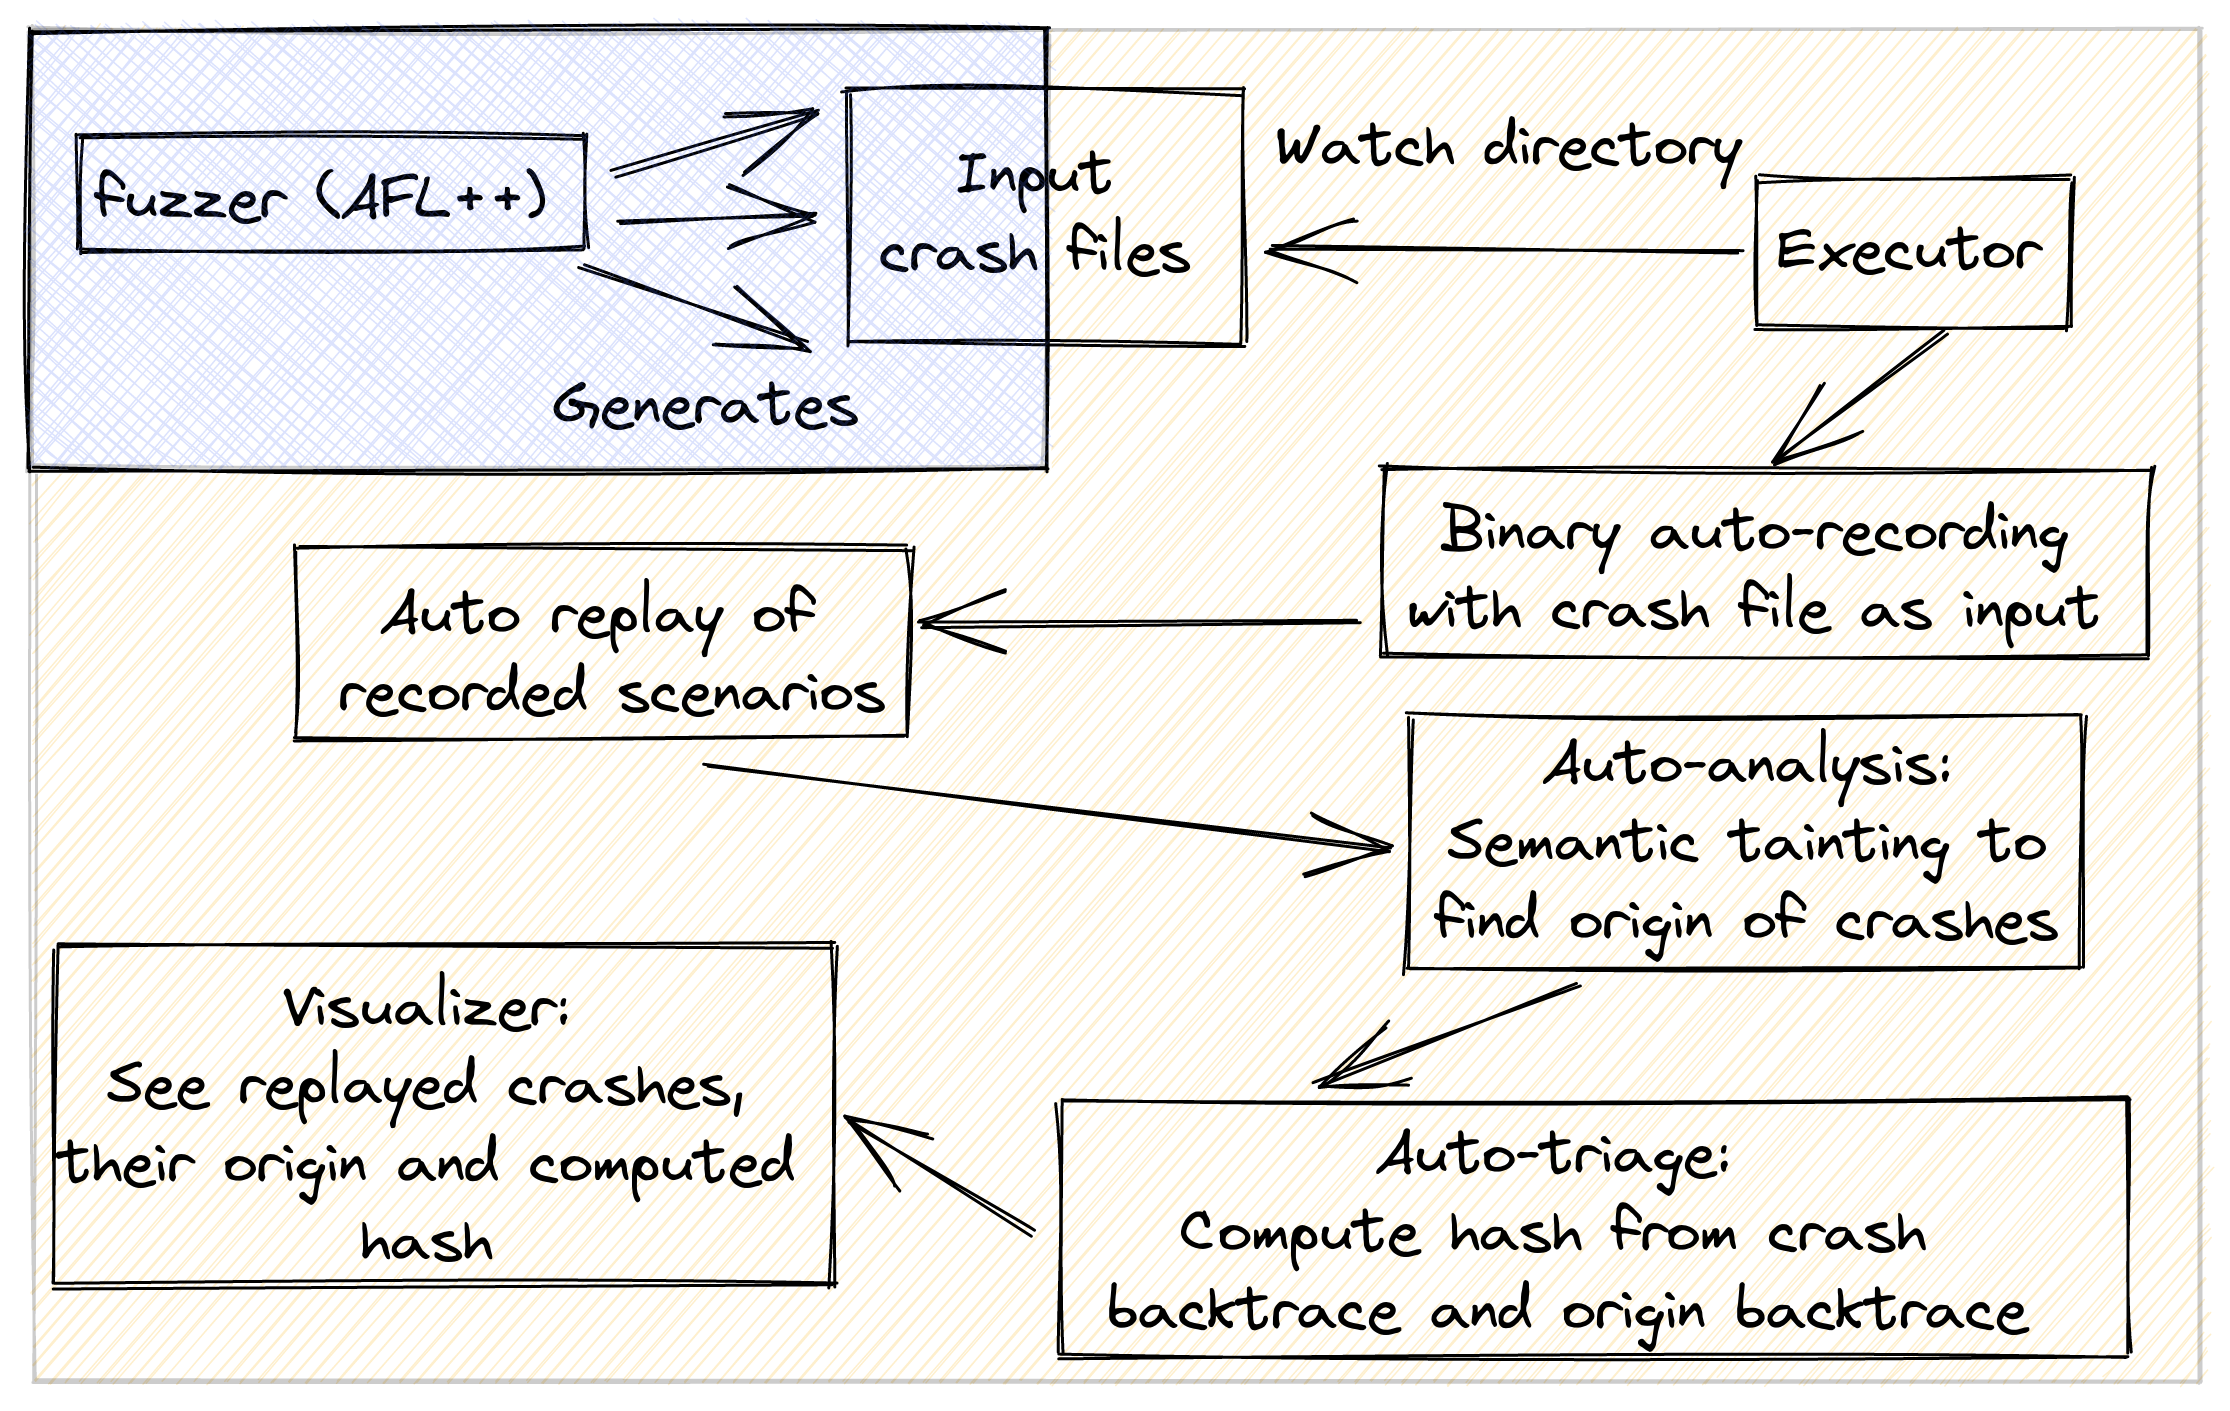
The platform can watch any directory for crash files. For each crash file appearing in the watched directory, the executor component of the platform will launch several steps:
-
Record a fresh esReven scenario from the test harness + the input file causing the crash. The record uses the workflow API that’s available in the Enterprise Edition of esReven, to automatically start recording at the beginning of the binary’s execution, and stop when it completes (or crashes, as is generally the case when using inputs from a fuzzer).
-
Replay the recorded scenario, still using esReven’s workflow Python API.
-
Analyze the replayed scenario, using esReven’s analysis Python API:
- Find the crash point by searching for ntdll!KiUserExceptionDispatch with the call search. We also extract interesting information about the crash, such as the kind of crash (division by zero, page fault, etc).
- Find the crash point by searching for ntdll!KiUserExceptionDispatch with the call search. We also extract interesting information about the crash, such as the kind of crash (division by zero, page fault, etc).
- Further minimize the number of “unique crashes” from the initial number reported by AFL, deriving a hash from the backtrace at the crash point and the backtraces of the origin points.
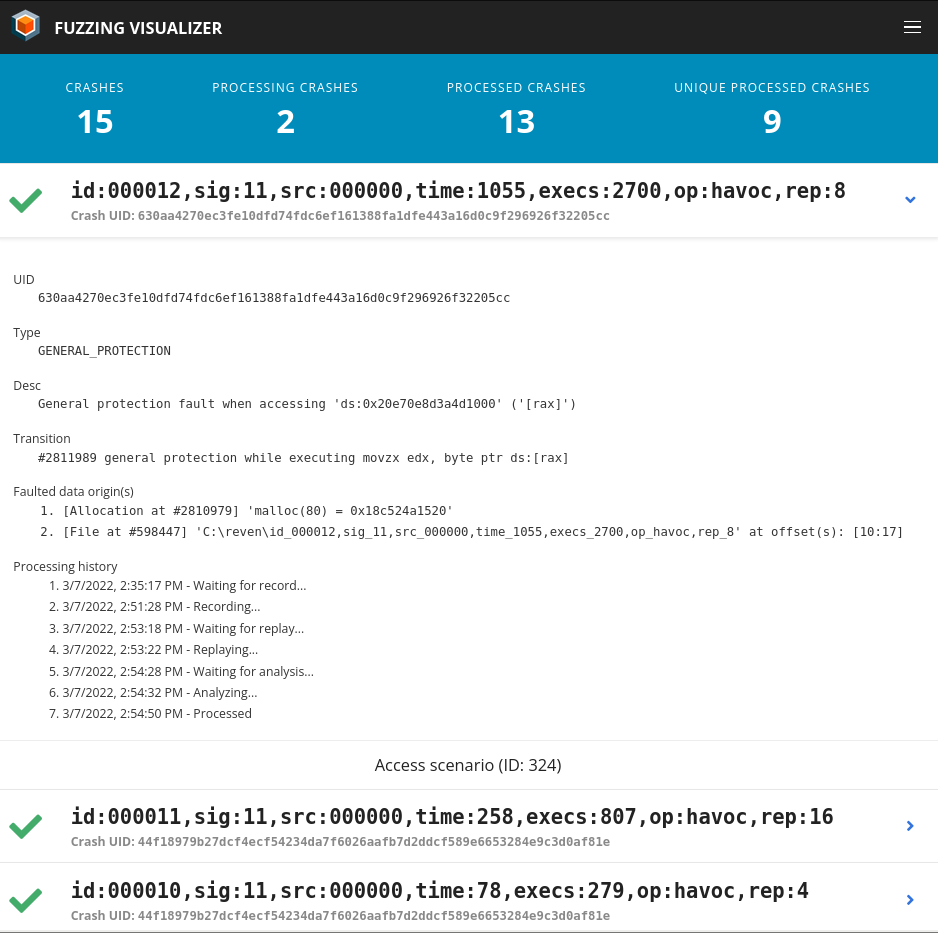
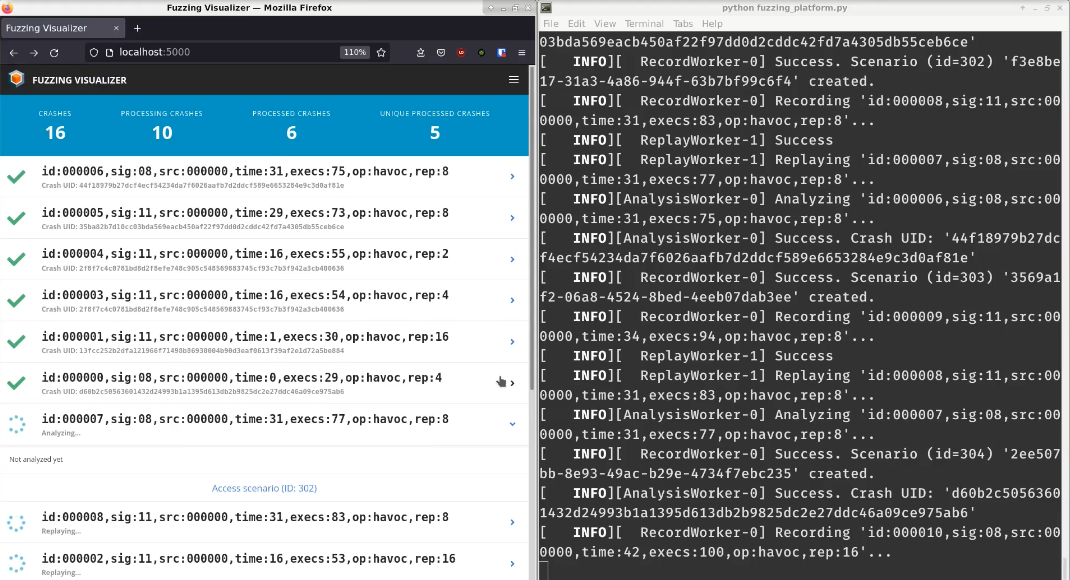
The current status and the final report for each crash file can be monitored live in the visualizer view, a web page locally served by the platform.
Semantic tainting
The taint engine of esReven is pretty unique in that it can follow the dataflow in the backward direction, essentially answering the question: “Where is this data coming from?”. A detailed introduction to esReven’s taint can be found in this previous article.
However the core taint engine focusses on giving the low-level information of which registers/memory areas are tainted, and which instructions the dataflow goes through.
To provide a more meaningful origin for crashes, such as the bytes in the input file responsible for the crash, or the allocated buffer causing the crash, we need to augment this low-level information with semantic information.
To achieve this goal, we look for specific, known functions in the backtrace while iterating over the tainted instructions. When a known function is hit, we then look if its return value or arguments are currently tainted. If it is the case, we can ascribe a meaning to that event, depending on what is tainted and on the function.
Here are a few examples:
-
The return value of malloc is tainted. This means that the tainted data originates with an allocated buffer, of size described by malloc’s parameter.
-
Part of the Buffer argument to NtReadFile is tainted. This means that the tainted data originates with the file pointed by the FileHandle argument. The precise offsets in the file can be found with some black magic involving reading the kernel structures to retrieve information about the handle.
We applied semantic tainting to a toy library with known vulnerabilities that we used as a fuzzing target, as well as on several crash files for vulnerable versions of clang-format.
Experimenting with Semantic tainting on a toy library
Here are some results from these tests:
- On the toy library, we found a divide by zero error:
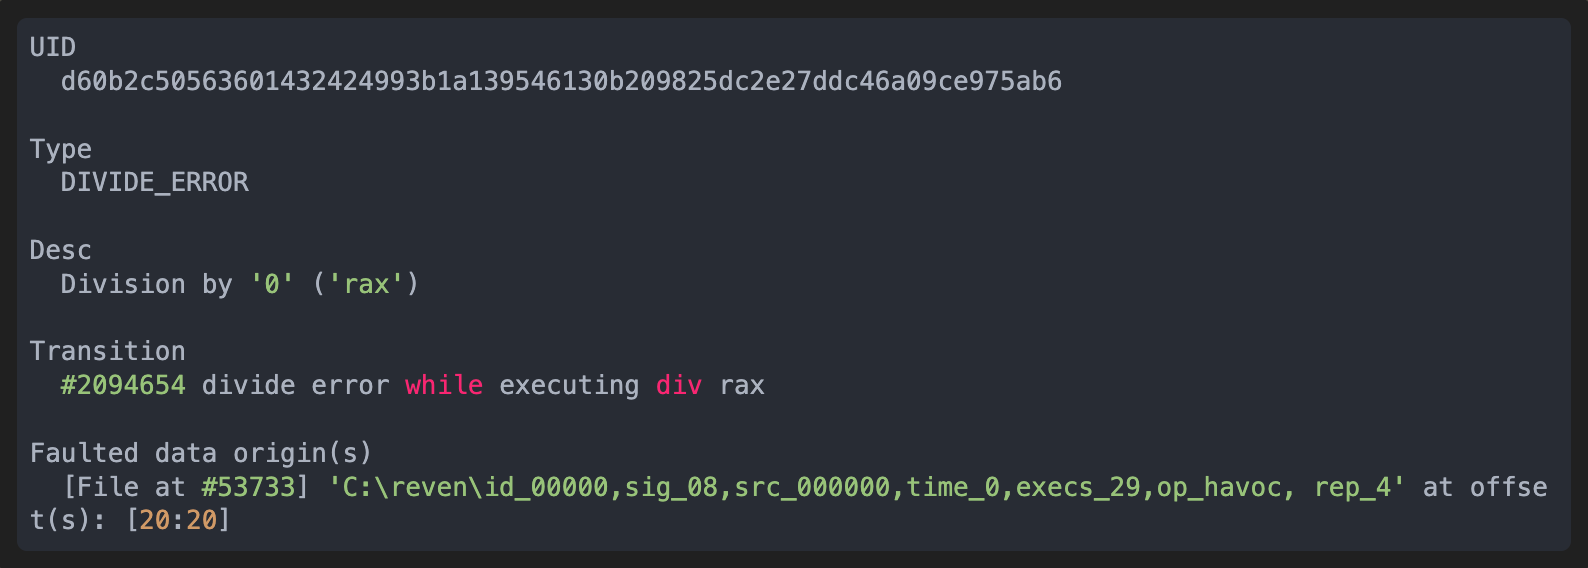
Semantic tainting retraces the divide error to the 20th byte in the input file that is the source of the crash.
- Another interesting case is this data pagefault:
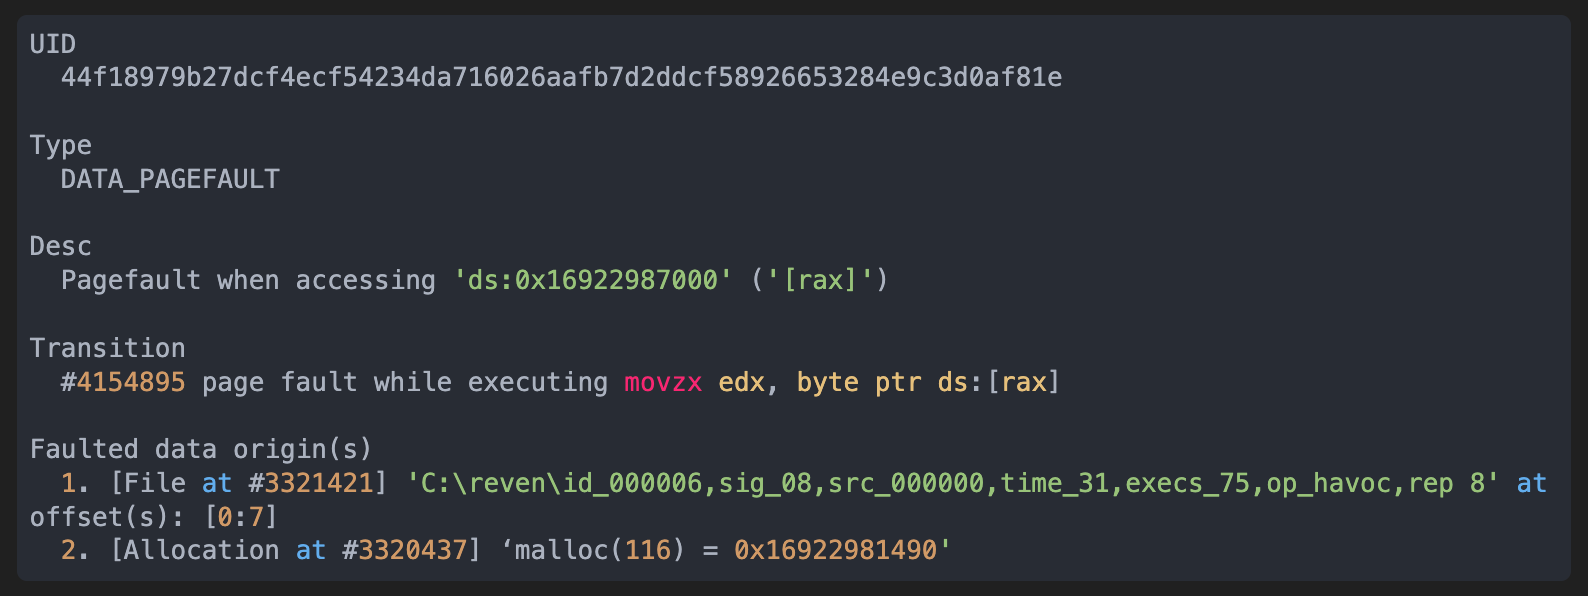
We can see that the value comes both from bytes 0 to 7 of the input file, and from an allocation of size 116 that returned the pointer 0x16922981490. The pagefault was caused by accessing 0x16922987000, which is out of the bounds of the allocated object.
Applying Semantic tainting on clang-format crashes out of OSS-Fuzz
-
Our first clang-format crash was the following:
- source: https://bugs.chromium.org/p/oss-fuzz/issues/detail?id=44956
- repro on Linux: Debian clang-format version 13.0.1-3 from Debian Bullseye (stable)
- repro on Windows: clang version 12.0.0 from https://llvm.org/builds/
- testcase: https://oss-fuzz.com/download?testcase_id=4821442364047360
- crash type: stack-overflow
- date: Tue, Feb 22, 2022 Running the analysis generated the following report:
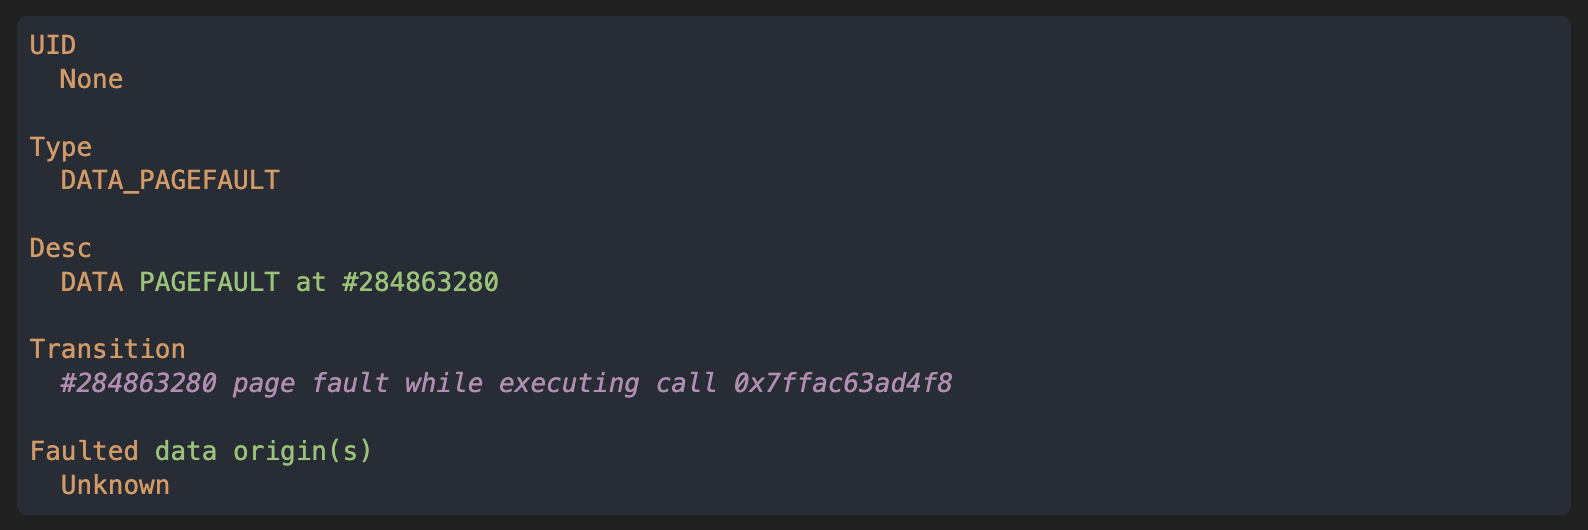
We can see that the crash occurs because of a data pagefault while executing a call, pointing towards a stack overflow.
- The second clang-format crash was from OSS-Fuzz too, and generated the following report:
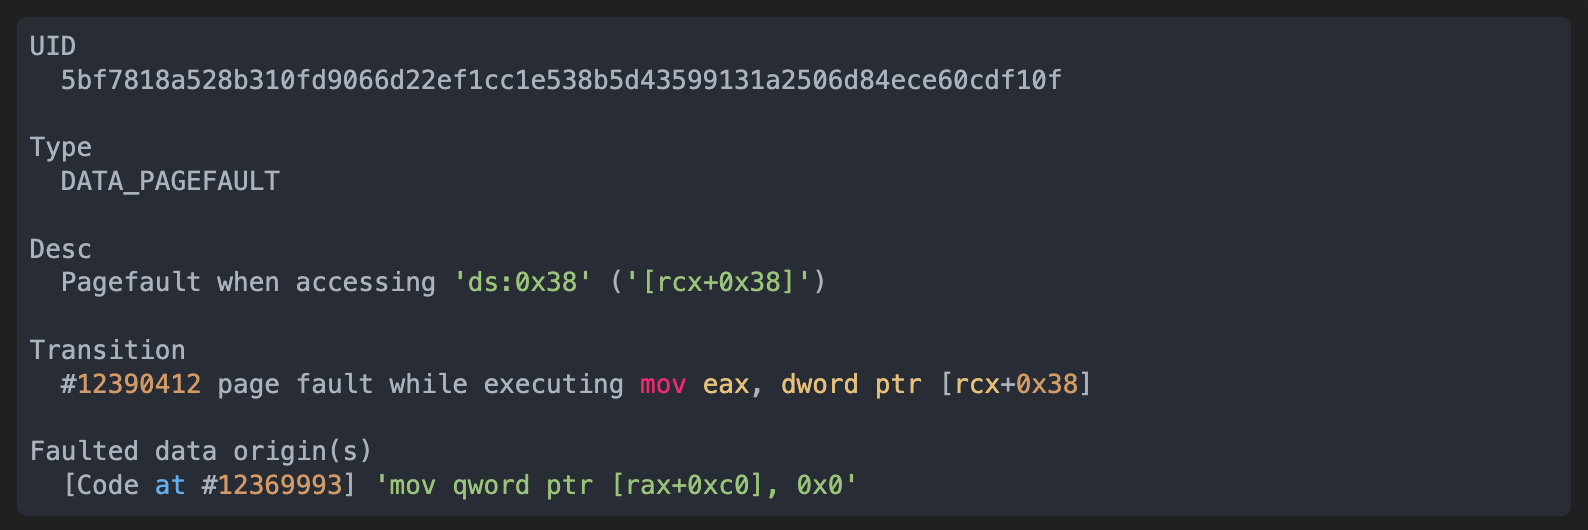
This time the data page fault is retraced by the analysis to an instruction where the immediate 0 is written to memory. This means that the page fault is cause by dereferencing a (quasi-)null pointer. The fact that it is an immediate tells us that the user cannot control this value.
Conclusion
The Fuzzing & Triage platform currently in development at eShard brings both integration with fuzzing tool chains and advanced automated crash root cause analysis capabilities thanks to a semantic layer on top of esReven’s taint engine.
We have tested it both on a specifically crafted toy library and on recent actual crashes detected by OSS-Fuzz on clang-format. The first results look promising and adding this semantic layer is an exciting development that we will carry on in the future!
Coming Soon: Join the beta!
Our current goal is to release a first iteration of esReven’s Fuzzing & Triage platform in the next version of esReven Enterprise Edition, hardening the platform by testing it on more targets, making it more flexible (such as allowing the user to plug their own analysis and generate customized reports), displaying more information… A beta program is open for current Enterprise customers. Get in touch for early access.
Inspired by what you saw? Feel free to ask any question or give feedback on our Twitter!
co-written by Louis Dureuil, Quentin Buathier & Mickaël Teyssier


