ALL-IN-ONE PLATFORM
esDynamic
Manage your attack workflows in a powerful and collaborative platform.
Expertise Modules
Executable catalog of attacks and techniques.
Infrastructure
Integrate your lab equipment and remotely manage your bench.
Lab equipments
Upgrade your lab with the latest hardware technologies.
PHYSICAL ATTACKS
Side Channel Attacks
Evaluate cryptography algorithms from data acquitition to result visualisation.
Fault Injection Attacks
Laser, Electromagnetic or Glitch to exploit a physical disruption.
Security Failure Analysis
Explore photoemission and thermal laser stimulation techniques.
EXPERTISE SERVICES
Evaluation Lab
Our team is ready to provide expert analysis of your hardware.
Starter Kits
Build know-how via built-in use cases developed on modern chips.
Cybersecurity Training
Grow expertise with hands-on training modules guided by a coach.
ALL-IN-ONE PLATFORM
esReverse
Static, dynamic and stress testing in a powerful and collaborative platform.
Extension: Intel x86, x64
Dynamic analyses for x86/x64 binaries with dedicated emulation frameworks.
Extension: ARM 32, 64
Dynamic analyses for ARM binaries with dedicated emulation frameworks.
DIFFERENT USAGES
Penetration Testing
Identify and exploit system vulnerabilities in a single platform.
Vulnerability Research
Uncover and address security gaps faster and more efficiently.
Malevolent Code Analysis
Effectively detect and neutralise harmful software.
Digital Forensics
Collaboratively analyse data to ensure thorough investigation.
EXPERTISE SERVICES
Software Assessment
Our team is ready to provide expert analysis of your binary code.
Cybersecurity training
Grow expertise with hands-on training modules guided by a coach.
INDUSTRIES
Semiconductor
Security Labs
Governmental agencies
Academics
ABOUT US
Why eShard?
Our team
Careers
FOLLOW US
Linkedin
Twitter
Youtube
Gitlab
Github
Analysis of the Uroburos malware with esReven
In this post, we present how Timeless Analysis can be used to analyze a few mechanisms of a Uroburos recent version. We use esReven and its integration with Volatility and IDA to detect indicators of compromise, analyze the dropping mechanisms and circumvent tricks the malware uses to hide itself.
The starting point of this analysis is a 50 seconds record of the Uroburos dropper executed from the desktop on a Windows 7 x64 SP1.
This article is also available as a video walkthrough:
The sha256 of the analyzed dropper sample is bcf10059be39f6ce338535a311508239c8db710fbbbc47b69249cb15b1454370, and a partial analysis of the driver already exists by Stefan Le Berre (@heurs).
Disclaimer: This analysis shows how esReven can be used to analyze some parts of a Uroburos version. There are multiple easily available analysis on older version of Uroburos that are way more exhaustive. Furthermore, we can see that this version of the malware is very light. One of the first thing that can be noted is that it doesn’t include any PatchGuard bypass, hence limits the amount of hooks compared to older versions.
Detecting IOC with REVEN and third party tools
First type of callback
esReven integrates really well with the tool Volatility. To use this tool, one usually have to create a dump, which is limited to a single moment in time. With esReven, Volatility can be applied to any moment in time of the recorded execution. We will see later that this specificity is of interest in our case.

In these results we can see a “GenericKernelCallback”, at 0xfffffa8001c77874, that has been set by an UNKNOWN module, which is suspicious. With esReven we can search its address in the trace to determine if and where this callback is executed:
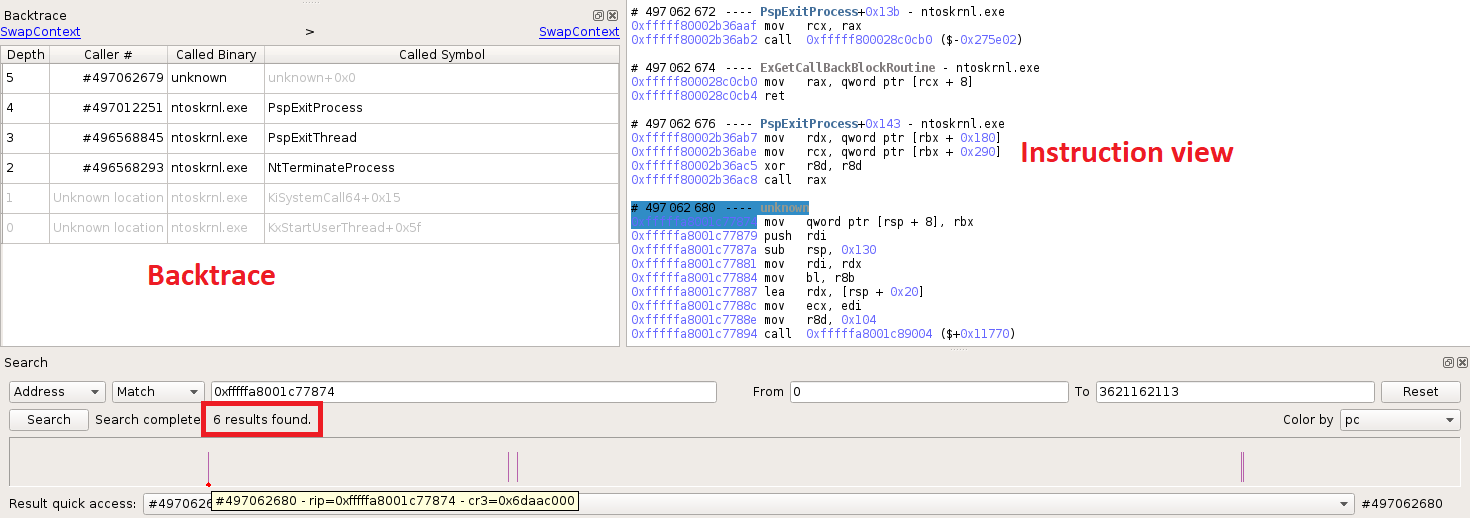
We can see from the above screenshot that this callback is executed six times in the trace, and the code of the callback belongs to an unknown binary. If we look at the instruction view or the backtrace for each of these executions, we are always in the context of a process termination, hence we can deduce that this callback has been set by ntoskrnl!PsSetCreateProcessNotifyRoutine(Ex). We can look for calls to this function:

It is called only once, and the notify routine argument is the aforementioned callback so this is the right place.
If you’re familiar with how the Windows system operates with process creation callbacks, you would know that the list of callback objects is stored in an array, that can be easily seen with esReven. The algorithm is simple, Ps(p)SetCreateProcessNotifyRoutine looks for the first available entry in the array and fills it with the new pointer to the callback object with ExCompareExchangeCallback. Accordingly, using the Memory History feature on this entry, we are able to find when the write of the new callback object occurs:
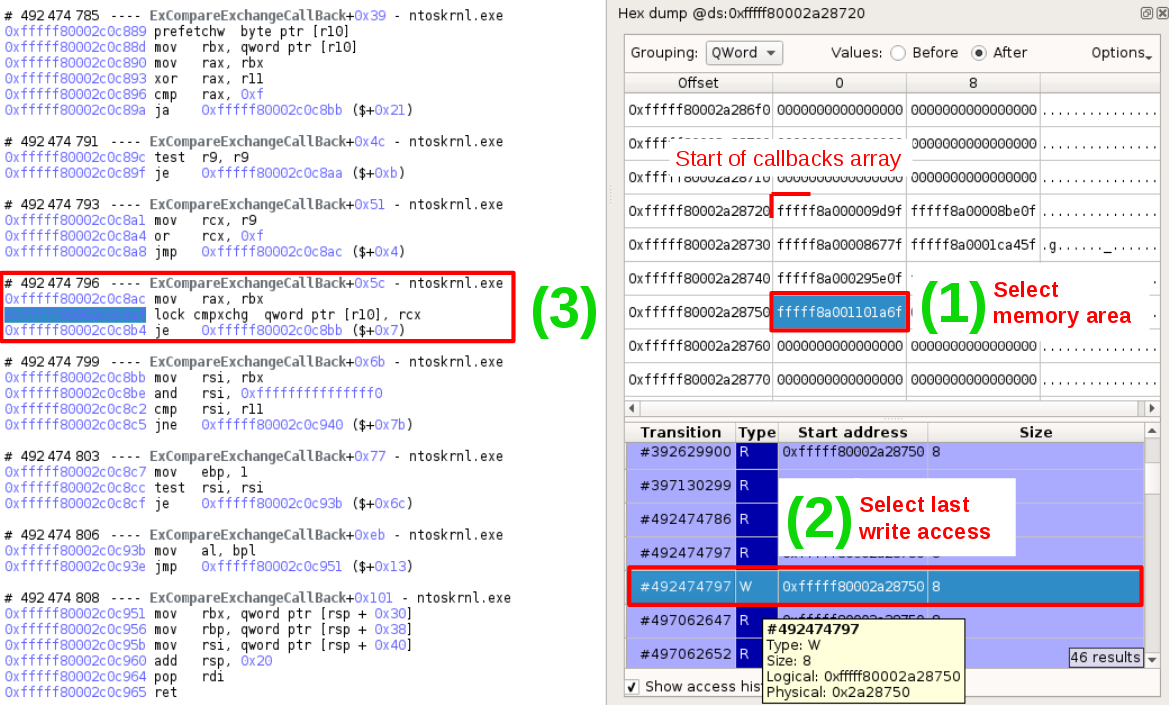
As an alternative, we could use the esReven Python API to script and automate the detection of rogue callbacks that are not set with PsSetCreateProcessNotifyRoutine.
Second type of callback
The second type of callback set by Uroburos are network callouts. They can be detected in two manners. The first one is by searching for the execution of fwpkclnt!FwpsCalloutRegister0. The second one is by looking at the array of callouts. As a matter of fact, Fwps callouts use the same idea than the CreateProcess callbacks, which is an array of structures defining the callouts. More precisely, the callout entries are added with netio.sys!FeAddCalloutEntry and in this function the callout array can easily be distinguished.
For this analysis, Uroburos calls FwpsCalloutRegister0 four times and we can retrieve the callback argument when it is pushed on the stack:
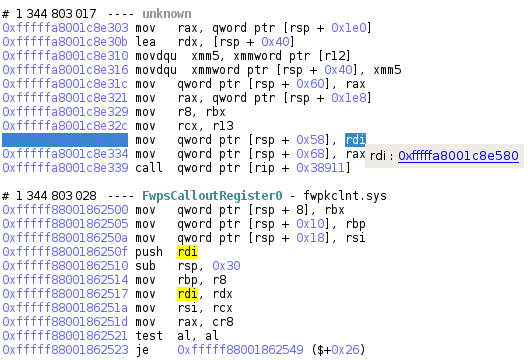
The four callbacks given as argument to FwpsCalloutRegister0 are:
- 0xfffffa8001c8e580
- 0xfffffa8001c8eca0
- 0xfffffa8001c8ede0
- 0xfffffa8001c8e580 (second time)
Of course these are addresses from the loaded driver, not offsets.
For the second part of this analysis we will show how to retrieve a sound version of binaries involved in the dropping of this malicious driver, and the driver itself.
Following and retrieving binaries during the dropping process
First insights with the Taint feature from esReven
The Taint feature is very powerful when analyzing crashes and vulnerabilities. When working on malware it is also very useful when combined with the Backtrace to follow each and every binaries involved.
Here, we will simply taint a byte of the code, for example from the function that calls the PsSetCreateProcessNotifyRoutine: in less than 1 second, the backward taint is propagated in the trace through half a billion instructions. The results show the propagation of the taint through each memory area, and we will analyze some of them.
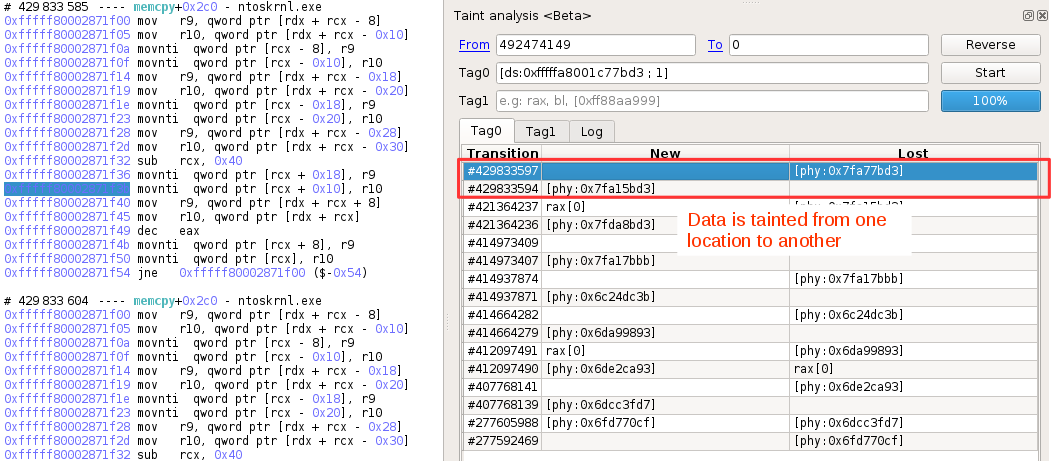
This first “memcpy” is responsible for the copy of the driver code. If we use the backtrace to go back to the call, we can get all its arguments, including the target address, which is the base address of Uroburos in this record.
Continuing to follow the taint propagation by double clicking the results, we find another “memcpy”, from a binary called usbehub.sys. Now this is interesting because the legit driver from Windows is called usbhub.sys, not usbehub.sys.
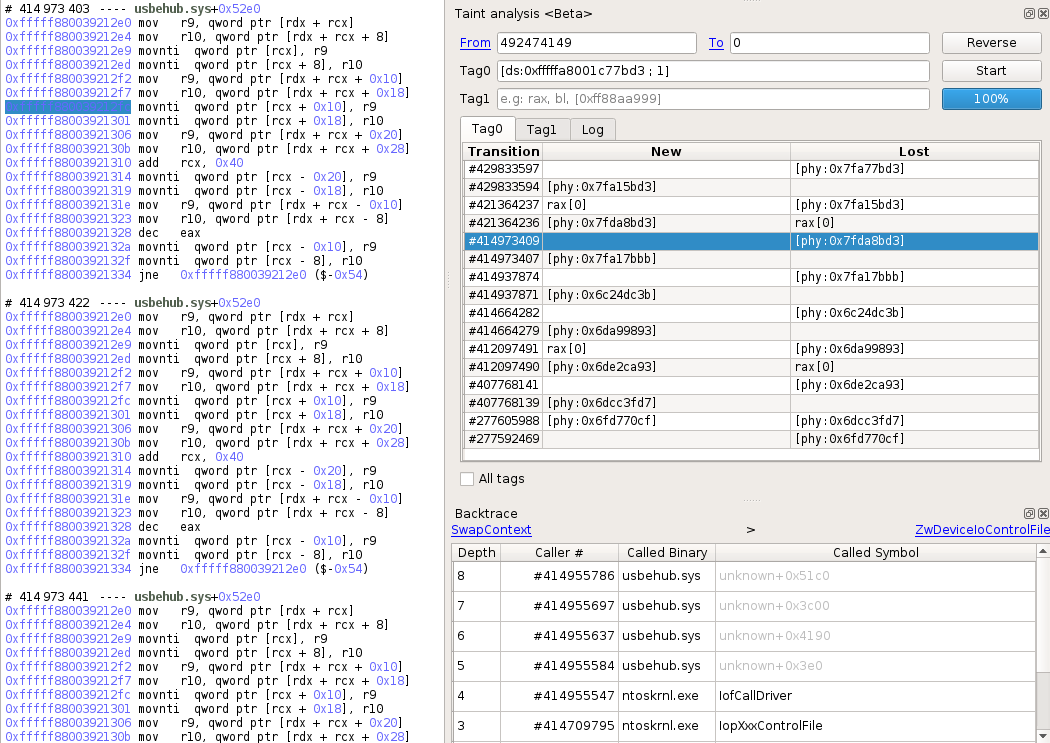
This is definitely a point of interest for us and we will see that later.
Next taint propagation shows another memcpy, and then we can see a user 32-bit “memcpy”, invoked by a binary named pxinsi64.exe:
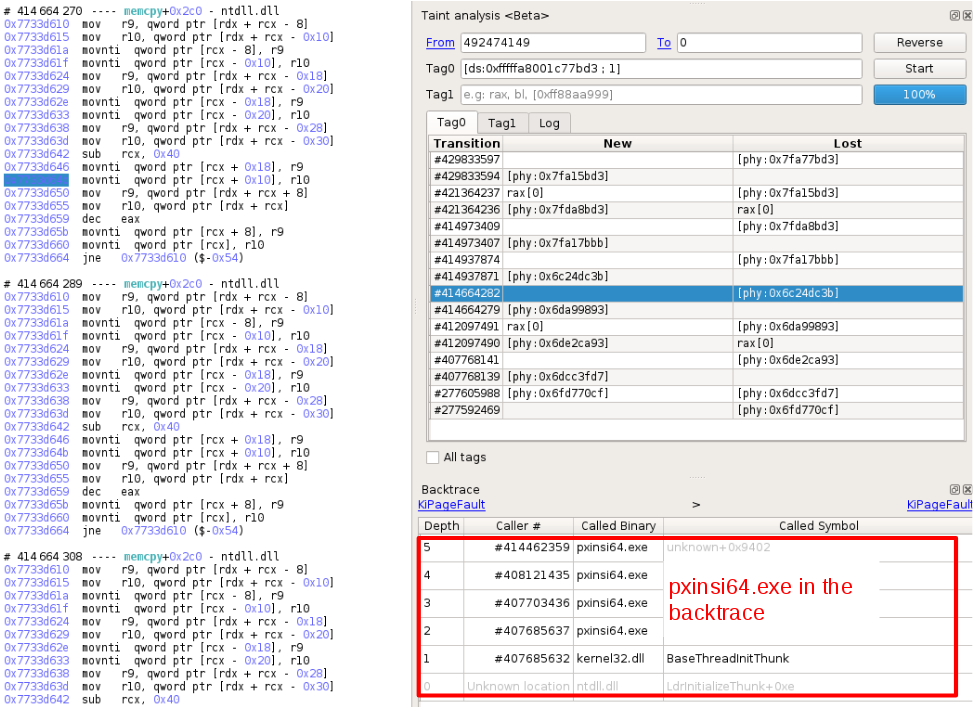
Also, since the previous taint was pointing to Kernel mode code and the current one is user mode, this binary is a point of interest as it seems to be the junction between User and Kernel mode.
Continuing this analysis, we reach the last “memcpy” detected by the taint, and the backtrace shows that it comes from the (renamed) dropper wololoooo.exe:
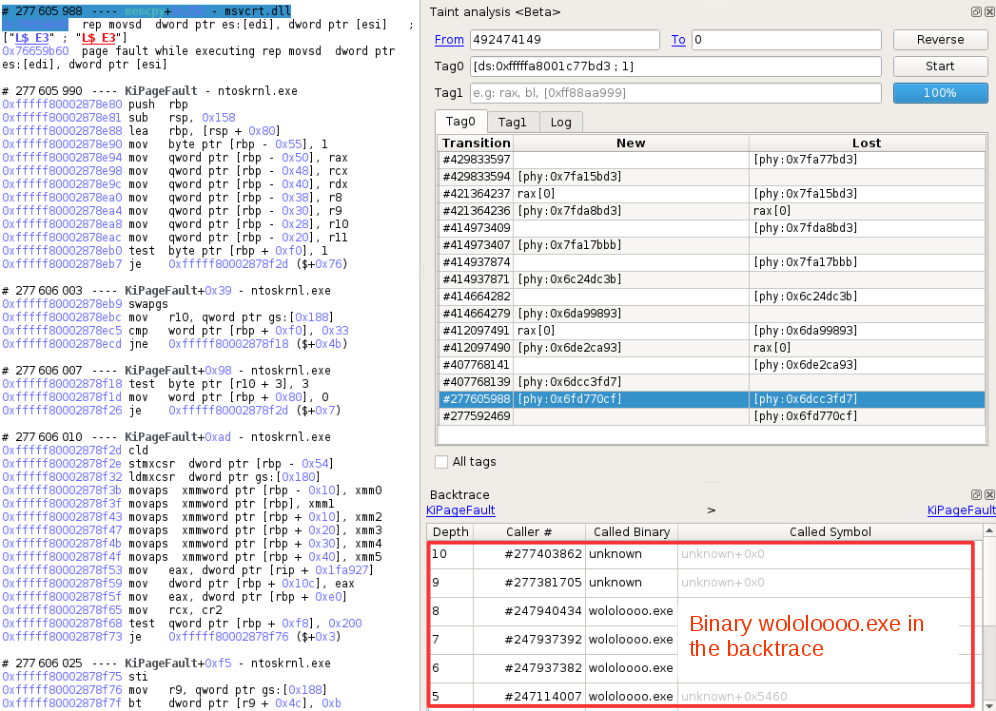
In the next part we will show how we are able to dump each binary and how we circumvented some tricks the malware uses to hide itself.
Dumping the Uroburos driver
We showed in the previous part that we are able to see the memcpy argument, and in particular that the base address was available. In this record, it is 0xfffffa8001c6d000, so we can use once again Volatility to dump it as it includes the moddump command that reconstruct the binary from the loaded image. We dump it near the end of the trace so that the driver is fully loaded:

The result of the command is somewhat wrong because of a bad DOS signature, but we can analyze this problem quickly with esReven by observing the memory history of this header. In the following screenshot, we can find that the two first bytes of the MZ header are overwritten, and with the memory history, we can know exactly when.
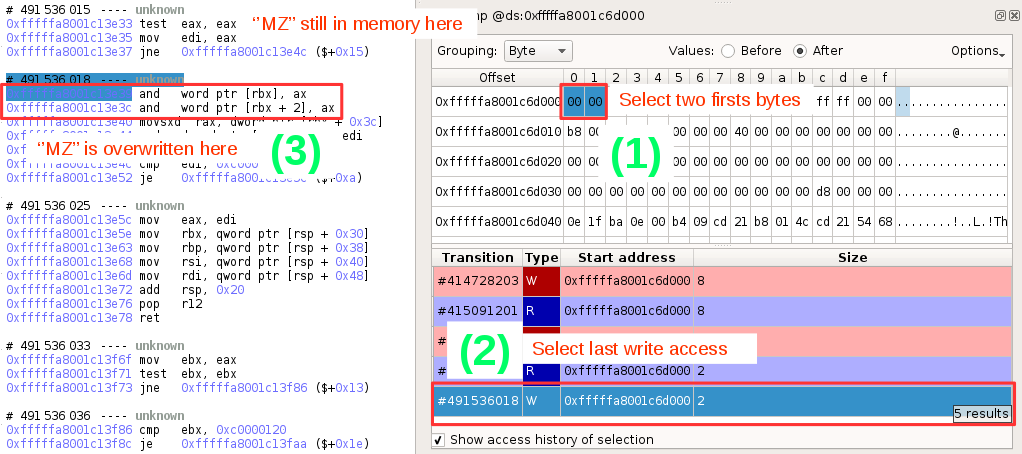
To perform a valid dump, we just need to indicate Volatility a moment in time after the loading of the malware but before the aforementioned overwrite. Right before the overwrite, at transition 491536015 seems ok:

This is where having esReven instead of dumping memory at an uncontrolled moment is useful.
The malware driver is now dumped and we can analyze it with our favorite disassembler. A comfortable approach of this is to rebase the binary to 0xfffffa8001c6d000 so that the disassembly correspond to the recorded trace. Then, no delta computation is necessary and for example, verifying if an unnamed function is executed or not is instantly performed through the Search feature.
Dumping the usbehub.sys driver
Now that we have dumped the malware driver, we are interested in this usbehub.sys we saw earlier. Following the same methodology we used for the malware driver, we can simply taint backward a byte of code of this binary to find out more precisely where it comes from. For this binary there are less results, yet combined with the backtrace we find some interesting information. For example, the fact that at some point this driver has been loaded from disk, and that the load implied a cryptographic validation with ci.dll!CiValidateImageHeader:
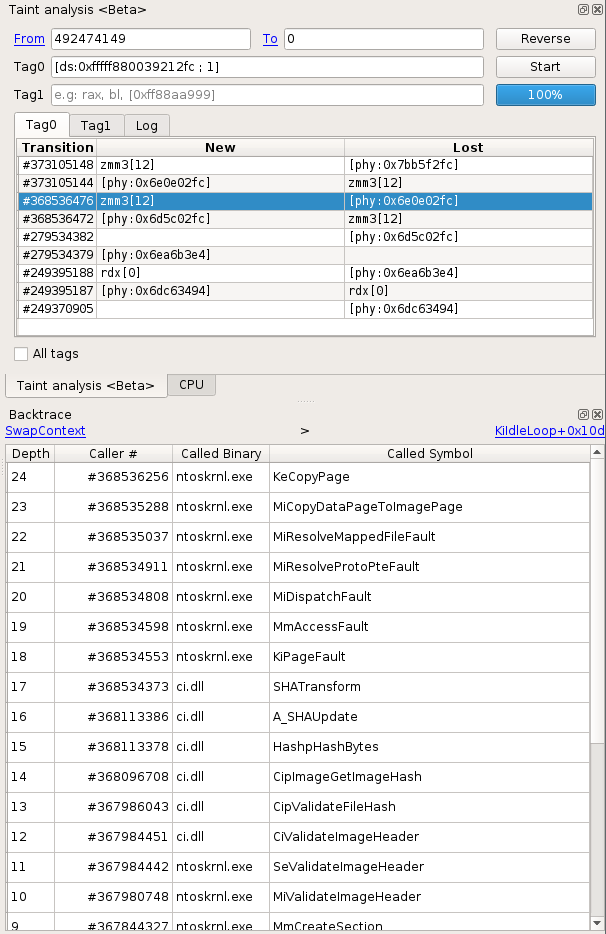
Almost right after in the taint results, we can see the ntoskrnl!NtWriteFile routine in the backtrace. This is useful for us because now we only need to dump the original buffer from the arguments. To do so, we can go back to the user call responsible for the Write, simply by scrolling up a bit in the trace and see that the WriteFile is performed by the dropper itself at this point, and that we can easily retrieve the buffer and the size in the pushed arguments:
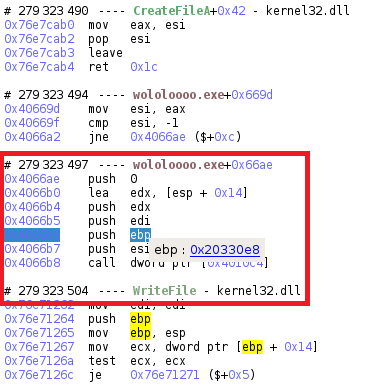
Since we know exactly what buffer is written on disk, we don’t need to reconstruct the binary from a loaded image, the easiest way is simply to dump the buffer with the Python API from esReven:
[CODE_4]
$ python2 dump_mem_reven2.py --host 127.0.0.1 --port 40687 -p 279323504 --mem "0x23:0x20330e8" --size 68288 --filename usbehub_279323503_20330e8_68288.bin
Done
Now, if we have a look at this driver we can see an interesting thing: it is a signed driver:
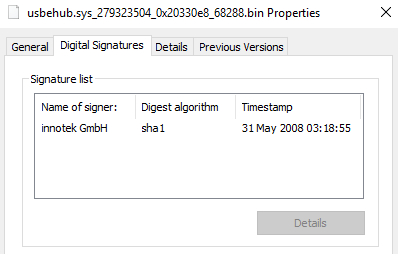
And simply opening it in your favorite disassembler will unveil some obvious strings and ask for pdb for the driver VBoxDrv.sys. So, clearly we’re facing the infamous VirtualBox driver used by many malware to install their own unsigned driver.
The next binary that we will dump is pxinsi64.exe, and at first sight it is the one responsible for the exploit of the driver, but we will see that it’s not that straightforward, and how esReven can help us with that.
Dumping the pxinsi64.exe binary
Just like we did with the usbehub.sys binary, to dump pxinsi64.exe we can use the taint to find the ntoskrnl!NtWriteFile, then the kernel32!WriteFile, and dump the binary from the buffer passed as argument:
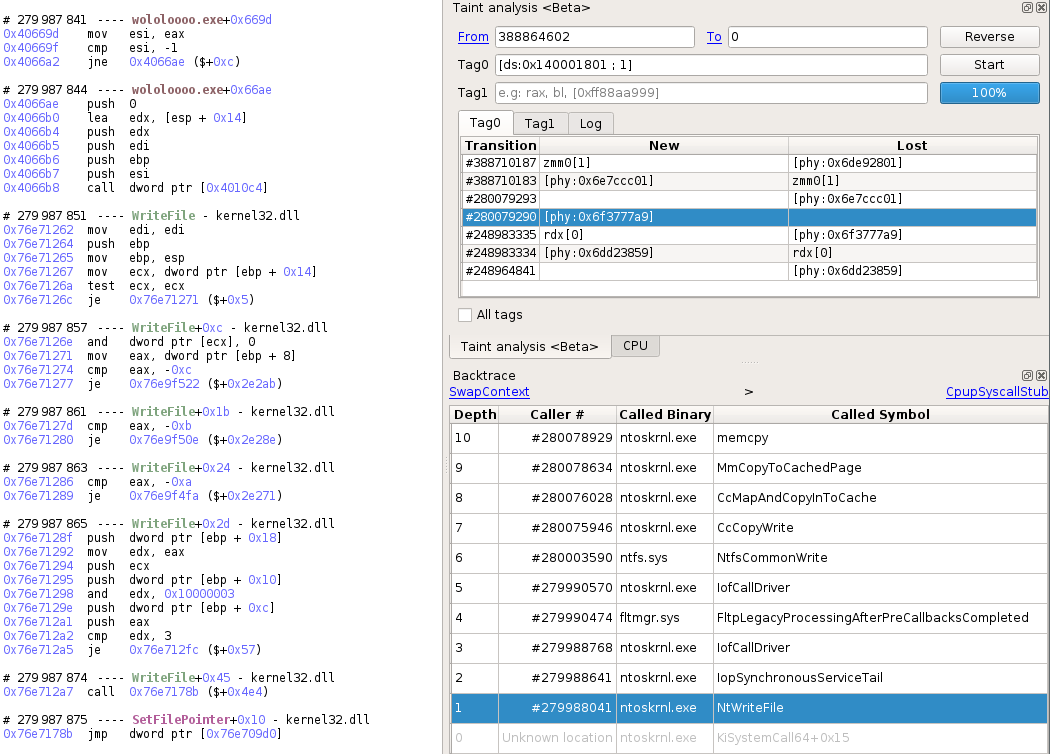
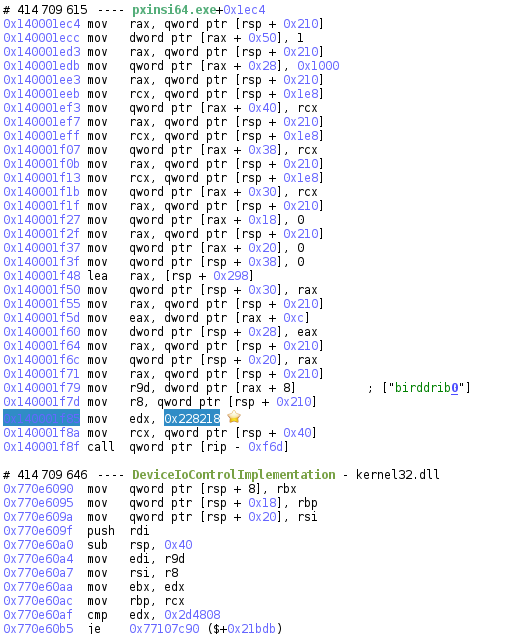
As we suppose that pxinsi64.exe is responsible for the exploit, we pursue the analysis by going back to the execution of usbehub.sys, and spot the NtDeviceIoControlFile in the backtrace. This lookout confirms our supposition as NtDeviceIoControlFile is originated by pxinsi64.exe:
What we can do now is use the IDA synchronization plugin, an adapted version of ret-sync from A. Gazet and link IDA with esReven to analyze with ease this exploit. But soon enough we realize that the executed function doesn’t correspond to the one in IDA, even though addresses are correct:
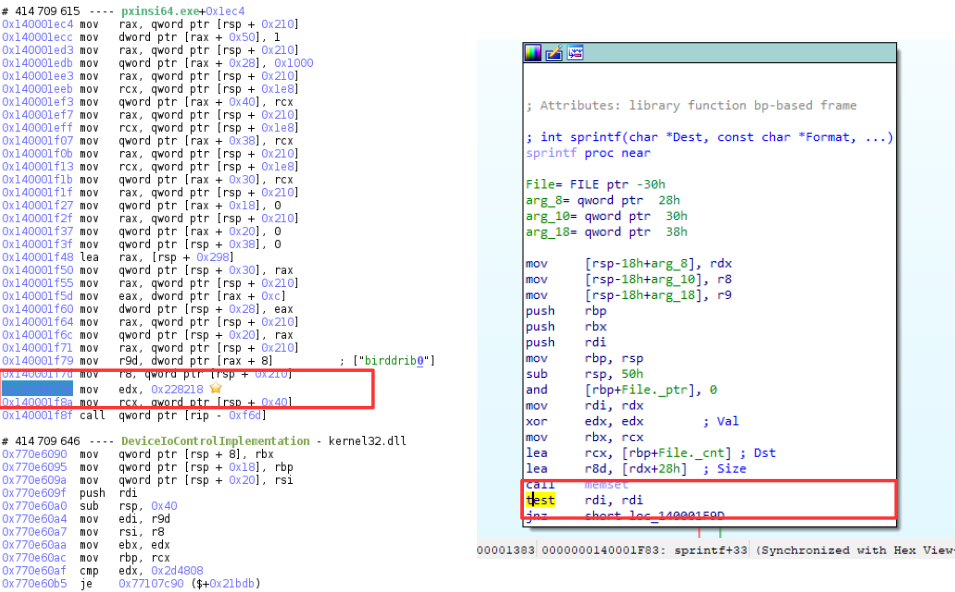
This difference is interesting as it points out that something happens on this portion of code. Using the memory history feature on it, we see that the last write on this portion of code is originated from a NtWriteVirtualMemory, which itself comes from pxinsi64.exe, but this time, the synchronisation is correct:
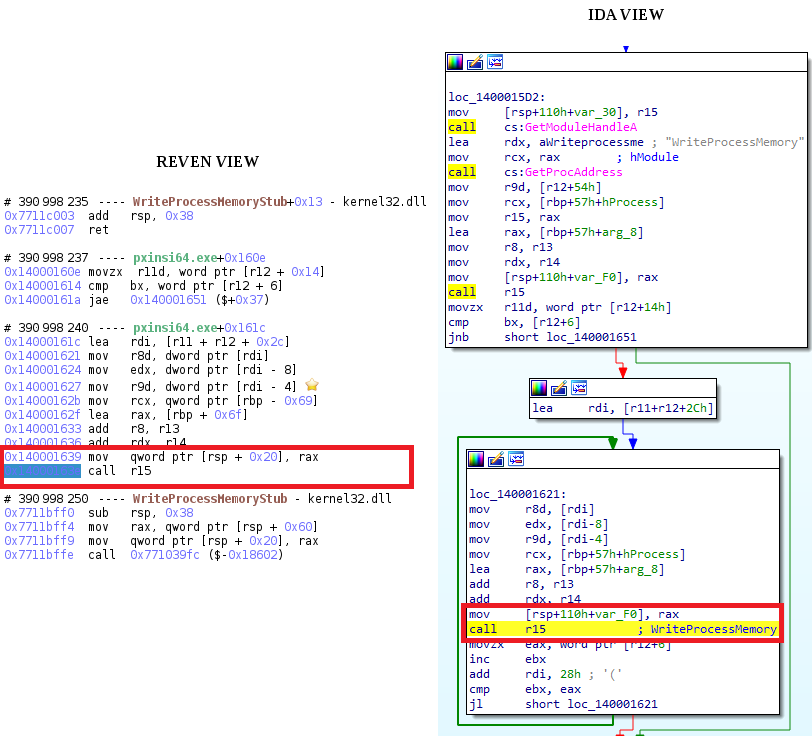
This means that pxinsi64.exe is rewriting itself with the exploit version of itself. With more analysis, the above loop is actually the loading of each section of the exploit binary, and the raw version is available in memory so we can dump it and analyze the exploit with IDA synchronized:
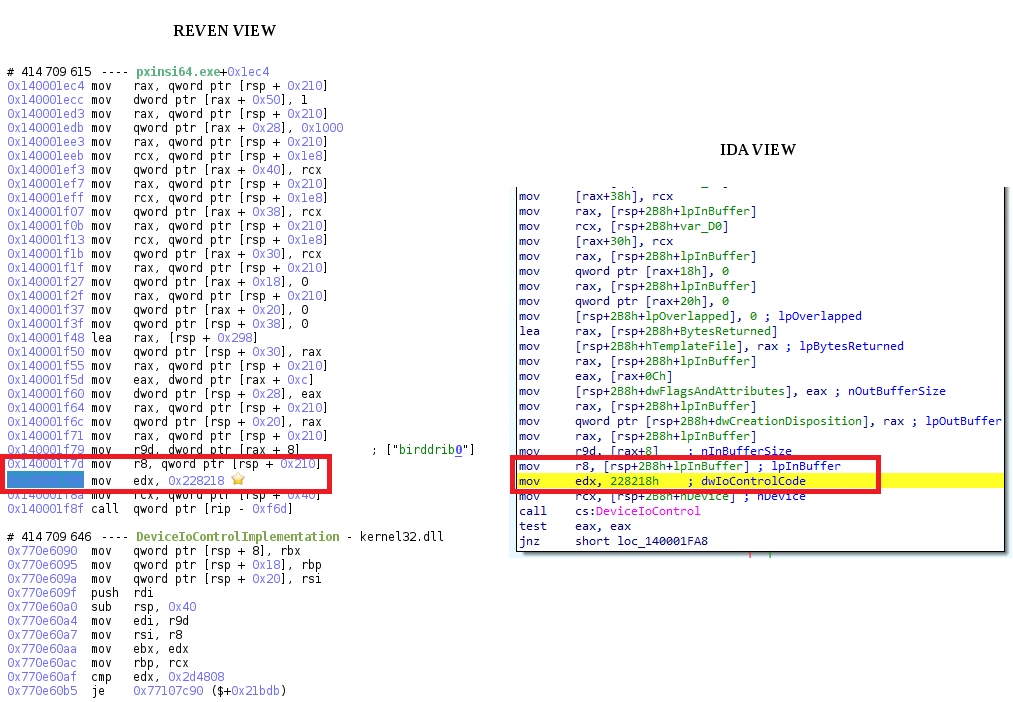
This is exactly the routine where the VirtualBox exploit is implemented, and now the analyst can explore it precisely with timeless debugging and IDA, without the pain of a kernel debugger.
Conclusion
This analysis focused on tracking suspicious behavior throughout the execution of a malware. Among other, we showed that esReven allows to quickly find the code responsible for setting malicious callbacks or exploiting a vulnerability, even if it lies in a kernel module, and dump the full binary if needed.
Especially, thanks to its Python API, we showed that not only it is easy to interact with the trace, but also that esReven integrates really well with third party tools such as IDA or Volatility in this case.
Generally speaking, since esReven allows us to instantly time-travel in memory, and that all memory accesses are indexed, dealing with hidden behavior or kernel exploits is very straightforward.
To go further
For more information about Reven, have a look at the following:
- This blog entry from Cisco Talos, showing how to prove or disprove exploitability of a crash
- This blog entry from eShard, showing how to analyze a Use-After-Free in Internet Explorer
- This blog entry from Thanh Dinh TA, reversing a deeply obfuscated challenge
- This white paper from Luc Reginato, presenting an updated analysis of PatchGuard on Windows 10 RS4
