ALL-IN-ONE PLATFORM
esDynamic
Manage your attack workflows in a powerful and collaborative platform.
Expertise Modules
Executable catalog of attacks and techniques.
Infrastructure
Integrate your lab equipment and remotely manage your bench.
Lab equipments
Upgrade your lab with the latest hardware technologies.


PHYSICAL ATTACKS
Side Channel Attacks
Evaluate cryptography algorithms from data acquitition to result visualisation.
Fault Injection Attacks
Laser, Electromagnetic or Glitch to exploit a physical disruption.
Security Failure Analysis
Explore photoemission and thermal laser stimulation techniques.


EXPERTISE SERVICES
Evaluation Lab
Our team is ready to provide expert analysis of your hardware.
Starter Kits
Build know-how via built-in use cases developed on modern chips.
Cybersecurity Training
Grow expertise with hands-on training modules guided by a coach.


ALL-IN-ONE PLATFORM
esReverse
Static, dynamic and stress testing in a powerful and collaborative platform.
Extension: Intel x86, x64
Dynamic analyses for x86/x64 binaries with dedicated emulation frameworks.
Extension: ARM 32, 64
Dynamic analyses for ARM binaries with dedicated emulation frameworks.
DIFFERENT USAGES
Penetration Testing
Identify and exploit system vulnerabilities in a single platform.
Vulnerability Research
Uncover and address security gaps faster and more efficiently.
Malevolent Code Analysis
Effectively detect and neutralise harmful software.
Digital Forensics
Collaboratively analyse data to ensure thorough investigation.


EXPERTISE SERVICES
Software Assessment
Our team is ready to provide expert analysis of your binary code.
Cybersecurity training
Grow expertise with hands-on training modules guided by a coach.

INDUSTRIES
Semiconductor
Security Labs
Governmental agencies
Academics

ABOUT US
Why eShard?
Our team
Careers


FOLLOW US
Linkedin
Twitter
Youtube
Gitlab
Github


Fine-tuned Windows scenarios: debugger-assisted recording with WinDbg


In this article we present a new way to leverage WinDbg to interactively control the VM during the recording of a scenario: this enables the user to more intuitively get to the point of interest and check conditions to control the execution, resulting in a more precise recording.
You can also check the documentation about the WinDbg integration in esReven in general.
The situation
Making recordings shorter is a key skill when using esReven. Among the tools and techniques available so far were the automatic binary recording and the ASM stub, which enable introspection and automation during this preliminary phase. In a previous article, we presented an interactive method to control the state of the VM, and thus the recording, from the hypervisor side using QEMU’s native GDB-server mode.
The latter is very versatile and is our go-to method in a number of different situations. However, since neither QEMU nor GDB are aware of the nature of the running kernel, it is also cumbersome: the absence of symbols requires creative workarounds, such as recording and replaying extremely short traces along the way to fall back on esReven's OS Specific Information (OSSI).
On the Windows side this led us to look at WinDbg, which can connect to a distant machine or VM and propose a native kernel debugging environment. Unfortunately, it does not seem to be possible to use the modern, fast Ethernet debugger connection with QEMU’s emulated hardware. Falling back on legacy serial debugger connection is possible, but our testing shows it is uncomfortably slow.
As a result we extended the Virtual Machine Instrospection (VMI) tools that powered the automatic binary recording to allow the REVEN-Kd Bridge to connect to a live running VM (whereas the existing WinDbg integration connects to a trace).
Example #1: recording a browser crash
Let us consider the same example as the GDB article: we want to start a recording on a call to chrome!net::HttpBasicStream::SendRequest and stop it when ntdll!KiUserExceptionDispatch is called (when the browser tab crashes). As we will see, using WinDbg for this task is more straightforward because the symbols are resolved automatically.
Connecting
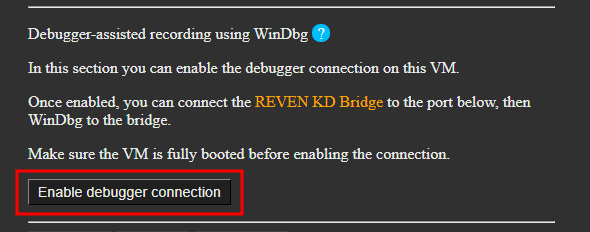
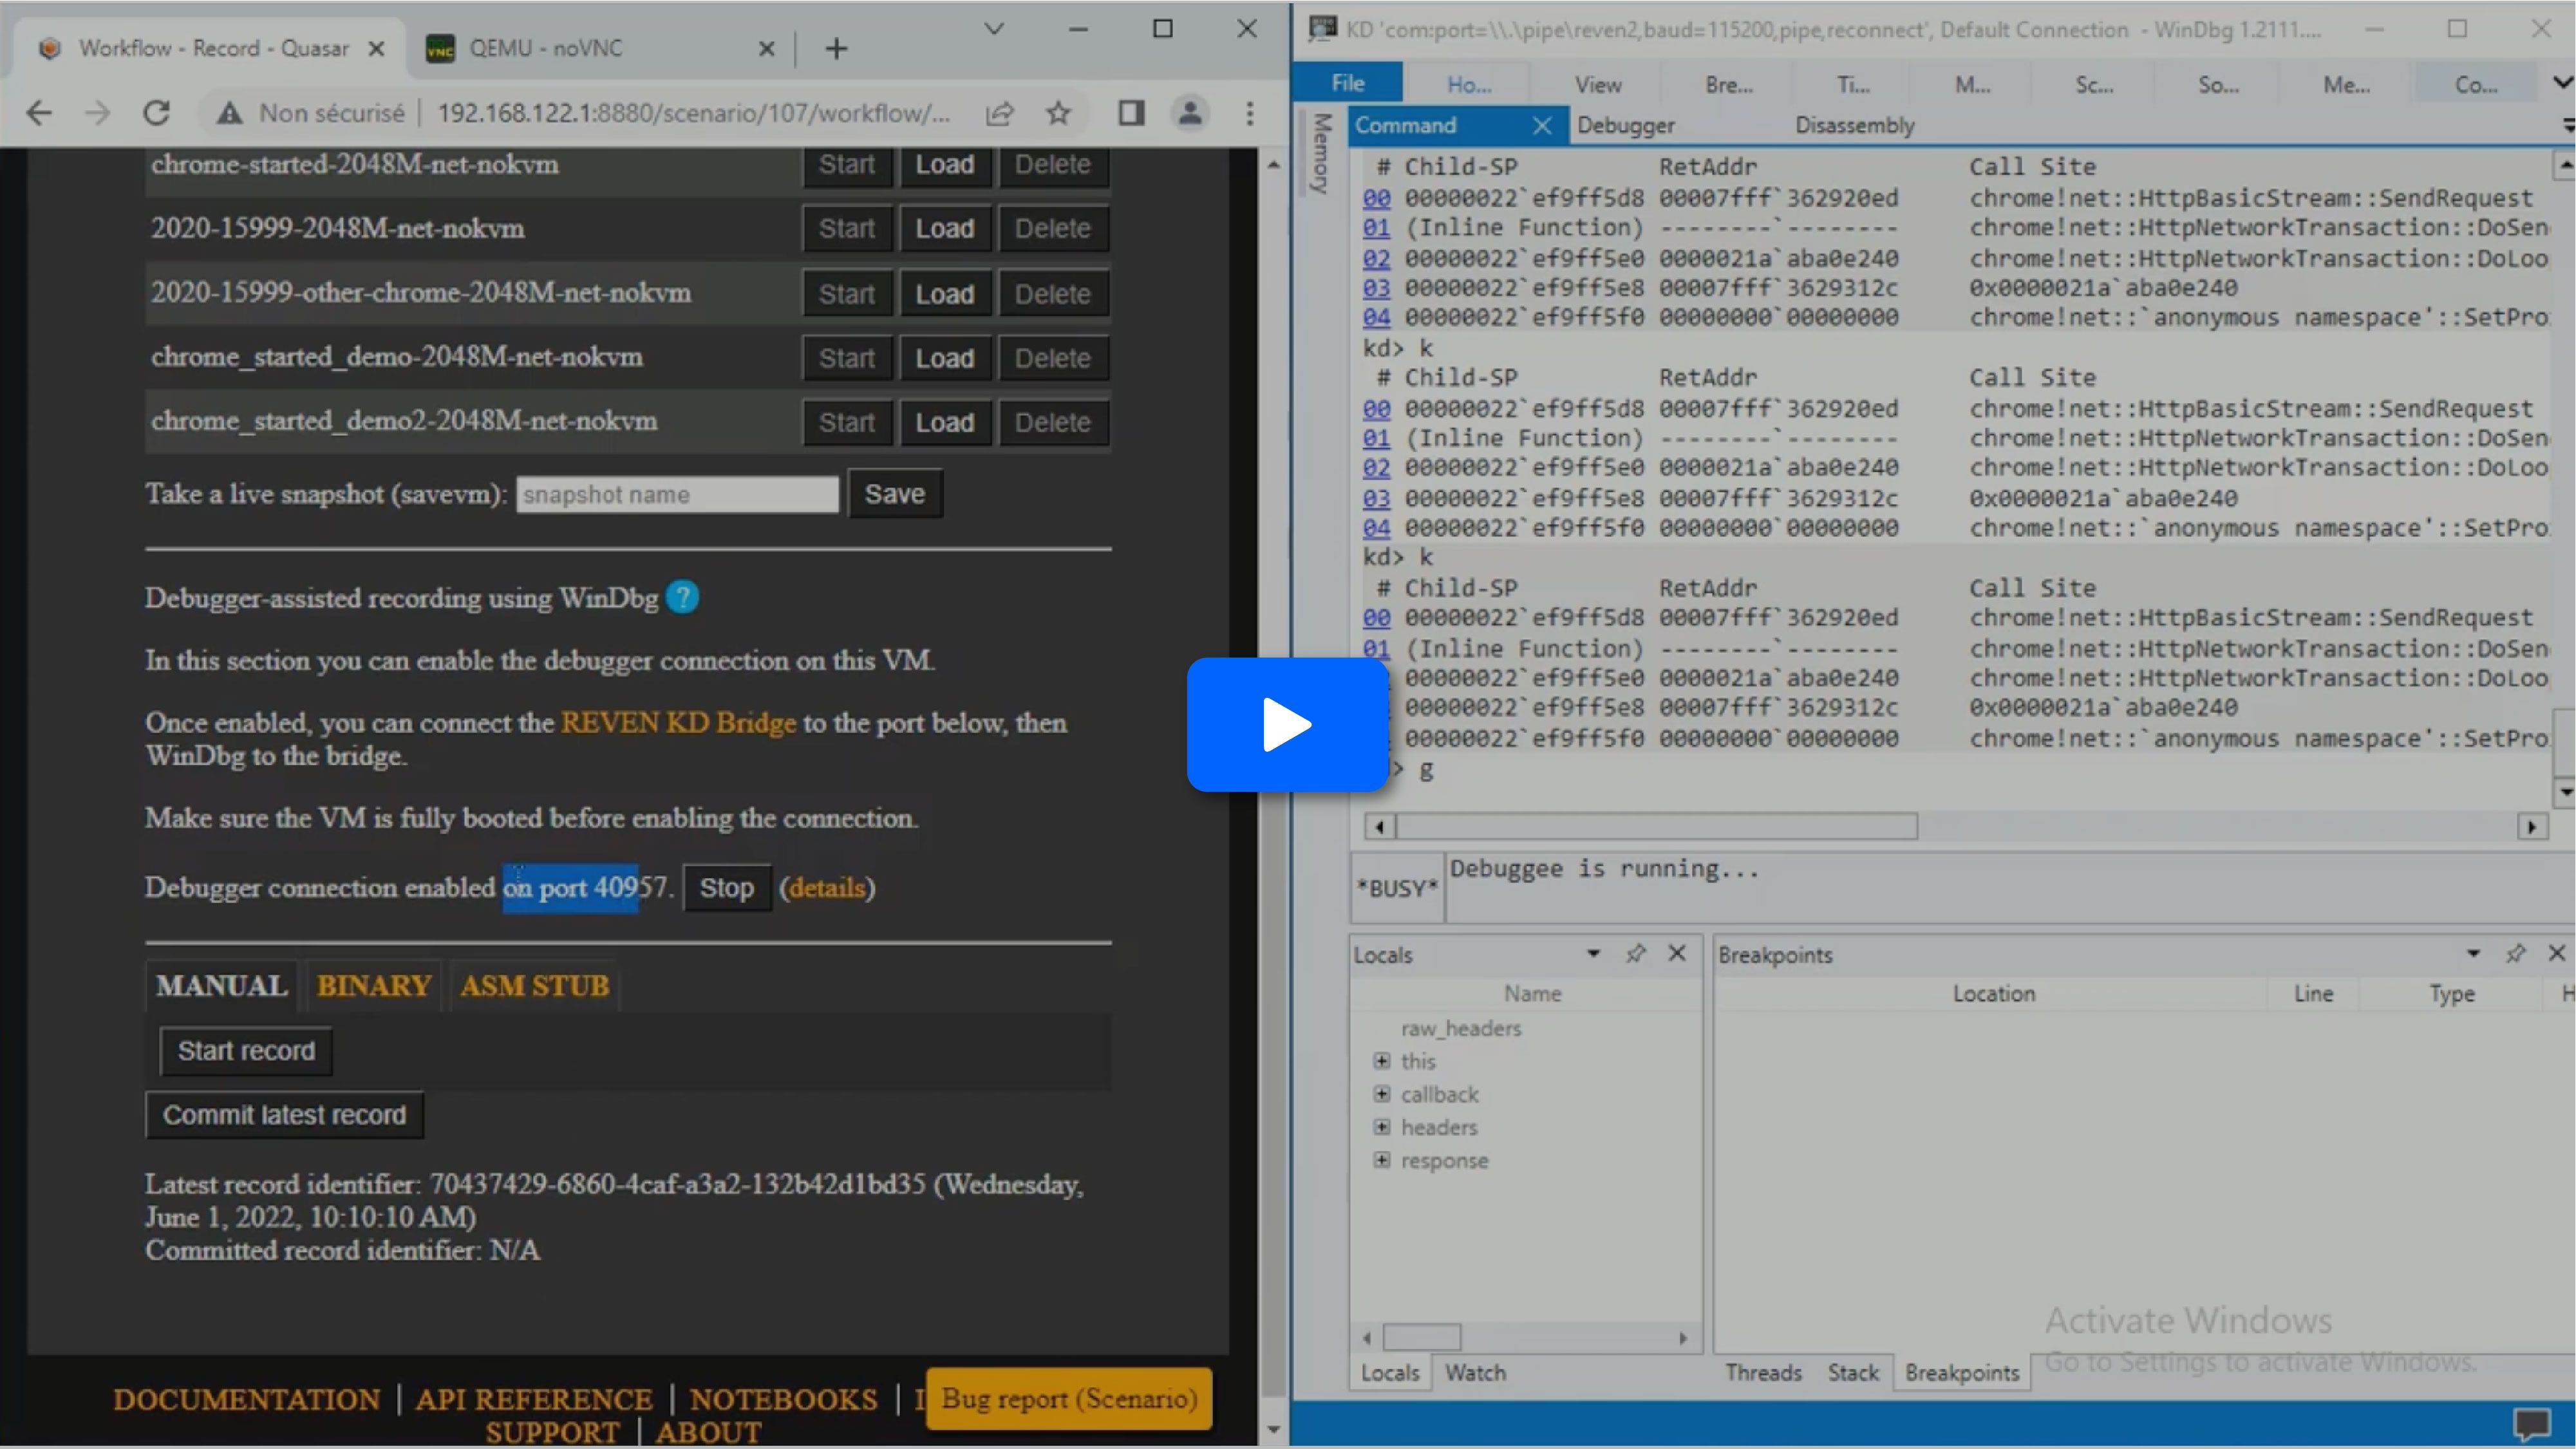
First, let’s restore a VM snapshot where everything is ready for recording. Then, we can start the WinDbg VMI backend:
Next, we connect the bridge to this backend, as we usually do when working with WinDbg on esReven traces:
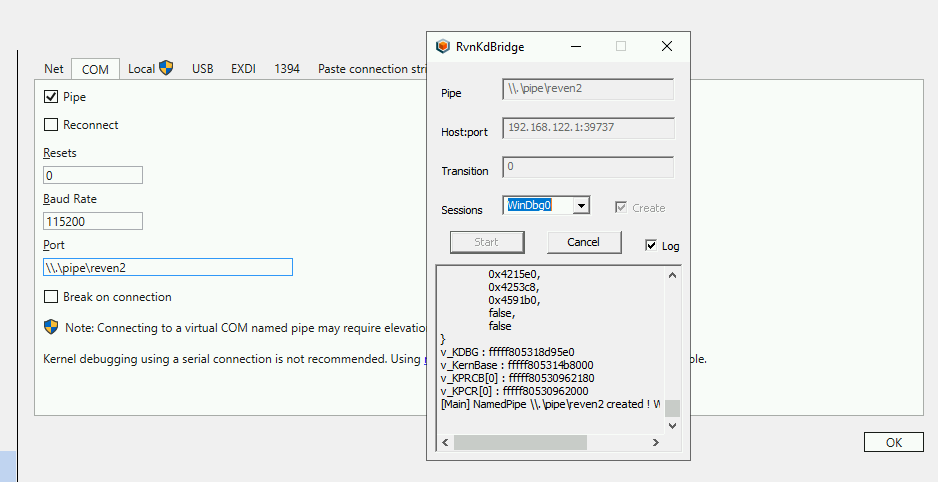
NOTE: even though we seem to connect WinDbg to a serial connection, this is actually passing through a named pipe and a network connection to the server — the displayed baud rate does not apply.
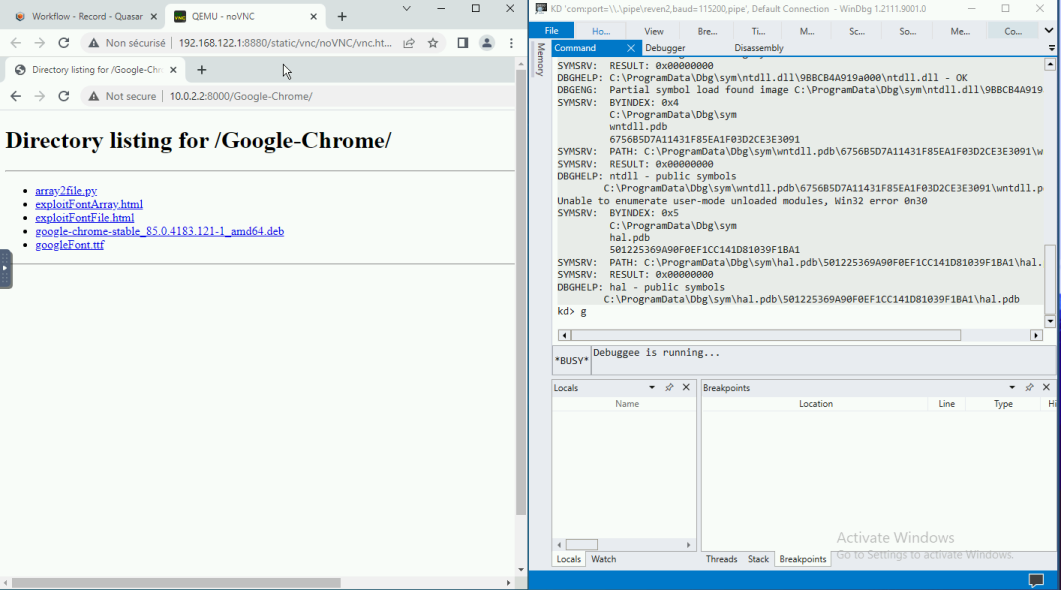
Finally, we connect WinDbg to this bridge. Everything is now setup and ready:
Usage
We can now control the VM through WinDbg. For our use case we must:
- Find the chrome process.
- Place the entry break point.
- Resume the VM.
We will use the following commands (see the 2.11.0 documentation for more details):

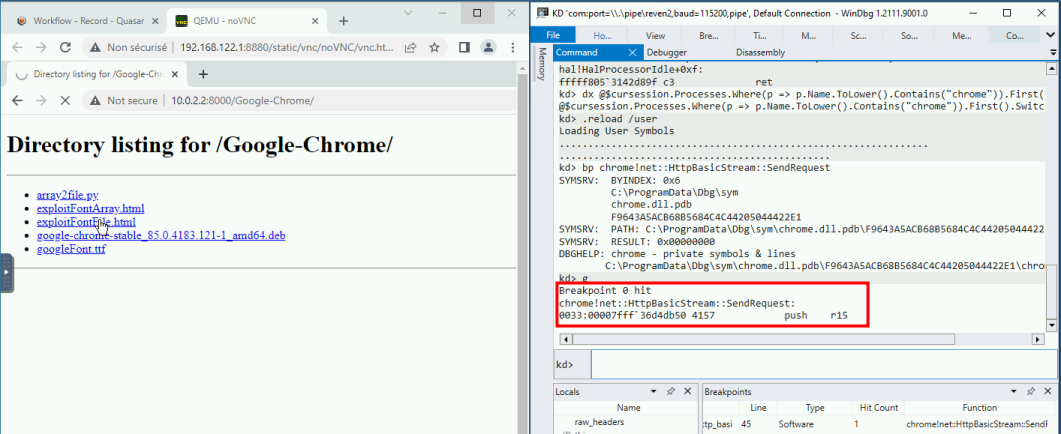
We now head over the VM and click on the exploit’s link. The VM breaks:
At that point, since the VM is paused, we can prepare the next steps in order:
- Disable the existing breakpoint as we don’t need it anymore
- Place a breakpoint on the crash handler. We use the following commands:

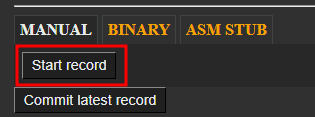
We now start the recording on the Project Manager’s page: the recording will actually start when the VM is resumed.
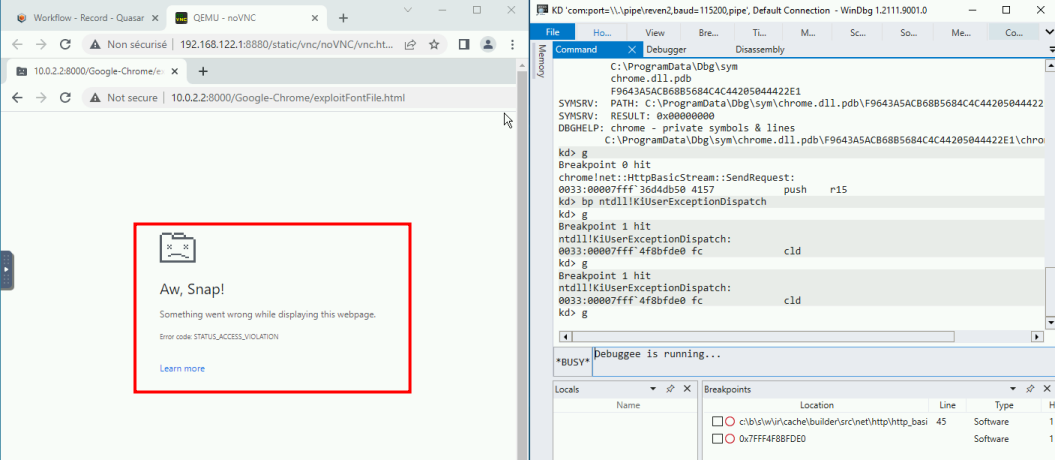
And we can now resume the VM with g. After a while the browser crashed, and the VM breaks again.
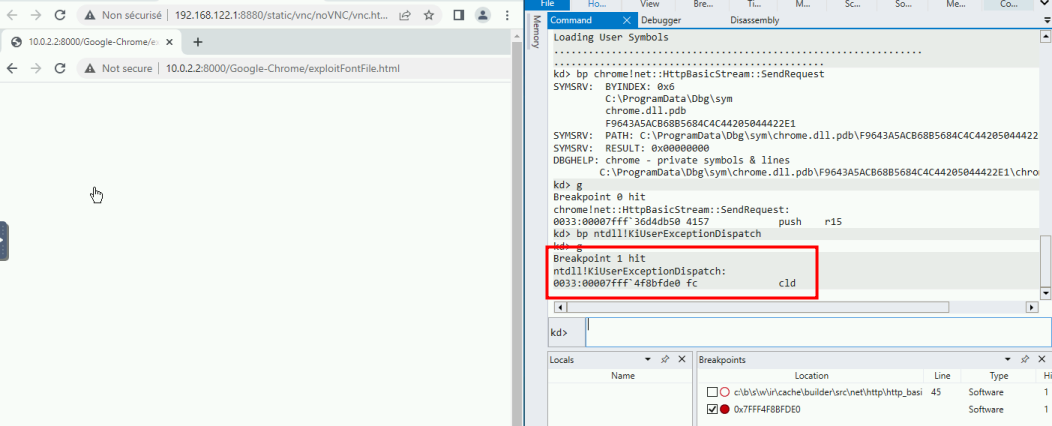
The breakpoint is set on the whole VM, so for good measure we should check that the crashed process is our target:
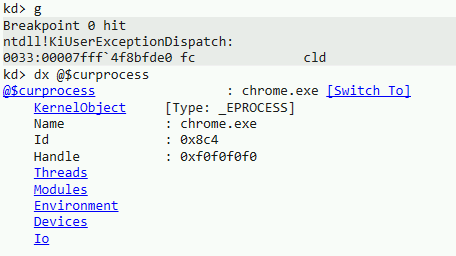
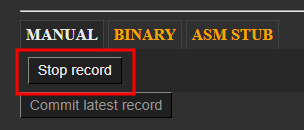
We are in the expected process. If not, we could have resumed the VM and the recording would have resumed as well. In our case, the target has crashed as expected, so we can stop the recording:
At this point, we can remove all breakpoints again and let the VM continue, again to make sure that our tab has crashed. This will not be part of the recorded trace.
We can now confidently commit the recording. The resulting trace will precisely start & stop where we wanted to, with little effort on our part.
Here is a video of the whole process, starting with a connected WinDbg:
Example #2: monitoring the life of a process
In the example above, the process is already started and waiting for a user input. In that situation, it is easy to break into the VM and place our breakpoints at any time.
Often, we will want to break at the start of a process in order to control its behavior as early as possible. WinDbg usually provides exceptions for this set with the sx* commands. However we cannot use these because the kernel is not aware that we are debugging it — this is a trade-off of using the bridge instead of a regular serial connection. See the 2.11.0 documentation for more information about the perimeter.
Thankfully, we can workaround this and monitor a process’ life manually.
Breaking on process start
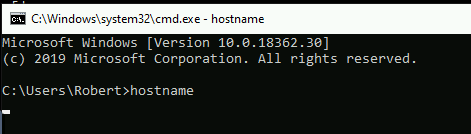
Let’s try to get into the entry point of a binary. We’ll use hostname as an example, but of course the same principle can be applied on any binary.
A very generic breaking point that will catch every process creation is nt!NtCreateUserProcess :

We now head over to the VM & start the process:
The VM breaks, and we must let the process creation finish:
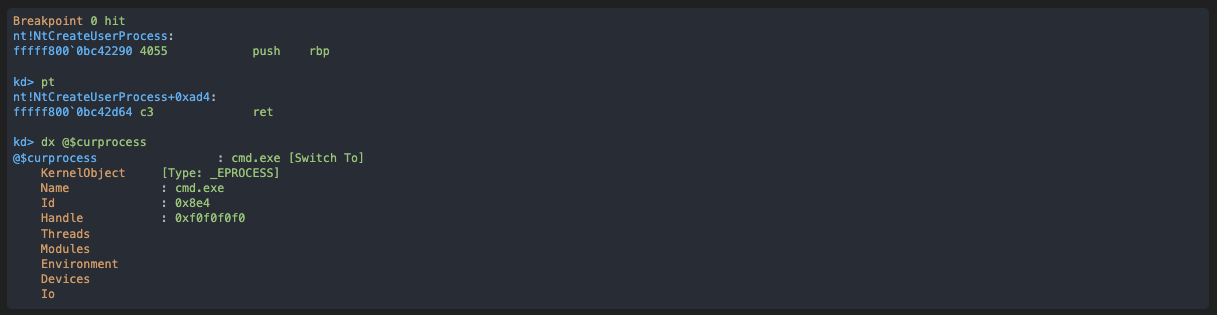
As you can see, at that point we are not yet into the context of our new process, even after exiting the function. However this process already exists and its entry point can be found by using the Debugger Objects.
First, we locate the process as we did before:

NOTE: we could also have checked the handle created by NtCreateUserProcess to find the process.
Now let’s find the entry point and get there:
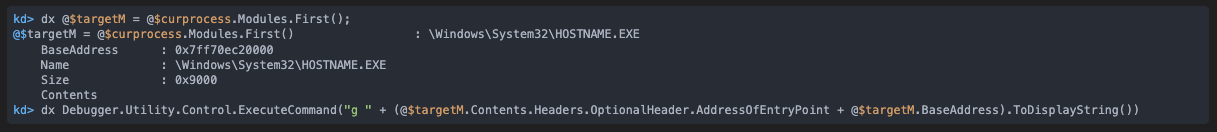
And we are now at the start of our process:
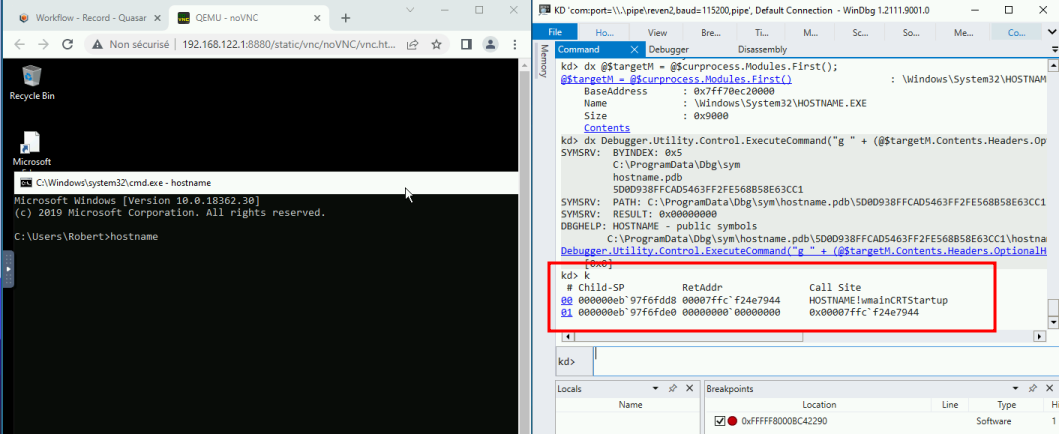
At this point we can have a precise control over the early life of our process.
Example #3: multi-process recording conditions
WinDbg being connected in kernel mode implies that following the execution between threads or processes is straightforward. Let’s take the example of a program that injects code into a separate, existing process — similar to what malwares sometimes do. We’ll assume we want to skip all the setup prior to the injection and record the injected code only.
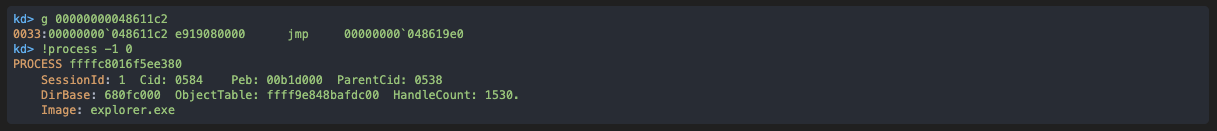
First, we start the program and locate its process as we did before. In our example, its kernel object is at 0xffffc8016f587580. Once that is done, we monitor this process for a set of tell-tale calls, so that we can monitor its activity and be certain of what we record:

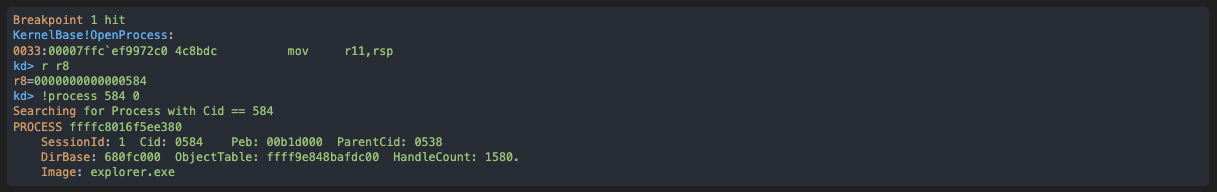
First, we get the OpenProcess call, telling us that the target for the injection is explorer.exe :
Let’s see which handle value will be used for this target:

Then, we see a memory write onto the target process via the handle previously created:

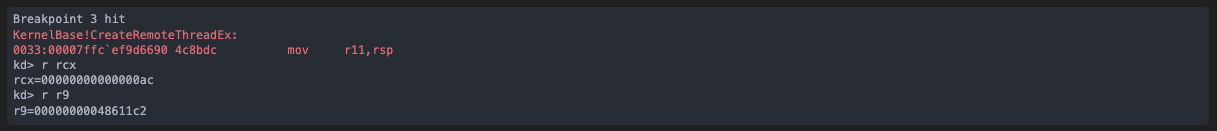
Finally, the CreateRemoteThreadEx against the target process gives us the injected code’s entry point in r9:
Now we just have to instruct WinDbg to resume until that code location is hit. It will be in a different process, but that is completely transparent to us:
And as we did in previous examples we can now:
- Head over to the Project Manager
- Start recording while the VM is paused
- Resume the VM with g — the recording effectively starts. As a result, we get a recording that leaves nothing to chance: we know it contains the injected code because we closely monitored the activity of the process prior to recording, and it starts at exactly the moment we wanted.
Supported perimeter
Due to the nature of the bridge connection, only a subset of WinDbg’s feature set is supported. Similarly to connecting WinDbg to a trace, reading memory or registers is supported, as well as code breakpoints.
However, memory breakpoints and any operations that would end up writing to VM are unsupported. This also means the following commands do not work:
- .process /i to switch to new process (but as we have seen, we can work around that)
- sx* commands
What about WinTTD?
WinDbg-assisted recording is strictly an improvement over the existing recording features of esReven. However, this does raise the question: when should we use esReven instead of WinTTD?
Both tools offer different features and trade-offs. First of all, while the feature sets have a lot in common they vary in significant ways: notably, esReven provides a tainting engine that is critical in solving certain situations. When it comes to usability, WinTTD is of course directly integrated in WinDbg and very light and easy to start using — on the other hand, esReven requires setting up virtual machines first. But the reason for this is that the perimeters are different: WinTTD is user-mode only, and esReven allows the user to record everything including multiple processes, driver or kernel code.
In the end, choosing one or the other will depend on what your use case requires.
Conclusion
In this article we have covered a few examples of situations where using WinDbg on the VM we want to record makes the recording process easier as it allows for far more precision and control, hence much lighter scenarios and smaller analysis lifecycles.
Once again, for more details take a look at the documentation about the WinDbg integration in esReven.
We hope you will enjoy this latest feature.