

Keep timeless analysis records to the point with REVEN and GDB
How to get the shortest record for a scenario? Given that a short record is synonymous with less recorded, replayed and analyzed instructions, this is a frequent question we receive about REVEN usage, with the goal of speeding up scenario replay and facilitating subsequent analyses with the Axion GUI and the API.
In the Enterprise Edition, you can use automatic binary recording and ASM stub out of the box from the GUI or with the workflow API to easily take short records, precisely tailored to your needs, possibly as part of an entirely headless process, such as in our upcoming Fuzzing & Triage platform.
This article will demonstrate an approach available in all editions to shorten scenario recordings. It leverages the -s QEMU option that enables you to connect a GDB client to the guest machine, which QEMU exposes as an entire system being debugged. You can then use this GDB client to go to specific code breakpoints and start the record, continue until you reach another code breakpoint or otherwise satisfactory end condition, and then stop the record.
Many of our CVE exploit analyses, such as CVE-2020-15999, had their record shortened using this technique.
Here are the basic steps to follow to perform a GDB-enabled record using REVEN 2.10.2 (also in the Free Edition):
- Find the address of the functions you want to add a breakpoint on, in order to derive the start and end of your record.
- Start the VM in GDB mode, and attach GDB to the VM.
- Use GDB to add breakpoints that pause the VM, and the Project Manager to record your scenario like usual.
- Replay your scenario!
Here’s an example of following these steps to record CVE-2020-15999.
1. Finding the addresses of the functions of interest
1.1. Identifying the functions of interest
In CVE-2020-15999, we want to find out what happens when we click a link to an exploit, so a good time to start the record would be when the net::HttpBasicStream::SendRequest method is called in chrome.dll.
From running the exploit, we know that it results in a crash of the Chrome tab where we clicked the link, which means that the process associated with the tab certainly crashed, causing a call to ntdll.dll!KiUserExceptionDispatch. This function seems like a good fit to end the record.
Now that we identified our functions of interest, we need a way to find their actual address in the system that we want to record. A simple way to do this is to record a first, short, scenario that ensures these binaries are executed during the record.
1.2. Preparing the VM
Make sure your VM has been prepared for use with REVEN. Further prepare the VM by installing the vulnerable Chrome, starting a fresh no-kvm session, starting Chrome, accessing the remote directory containing the files for the exploit, and waiting for a while for the CPU of the VM to calm down.
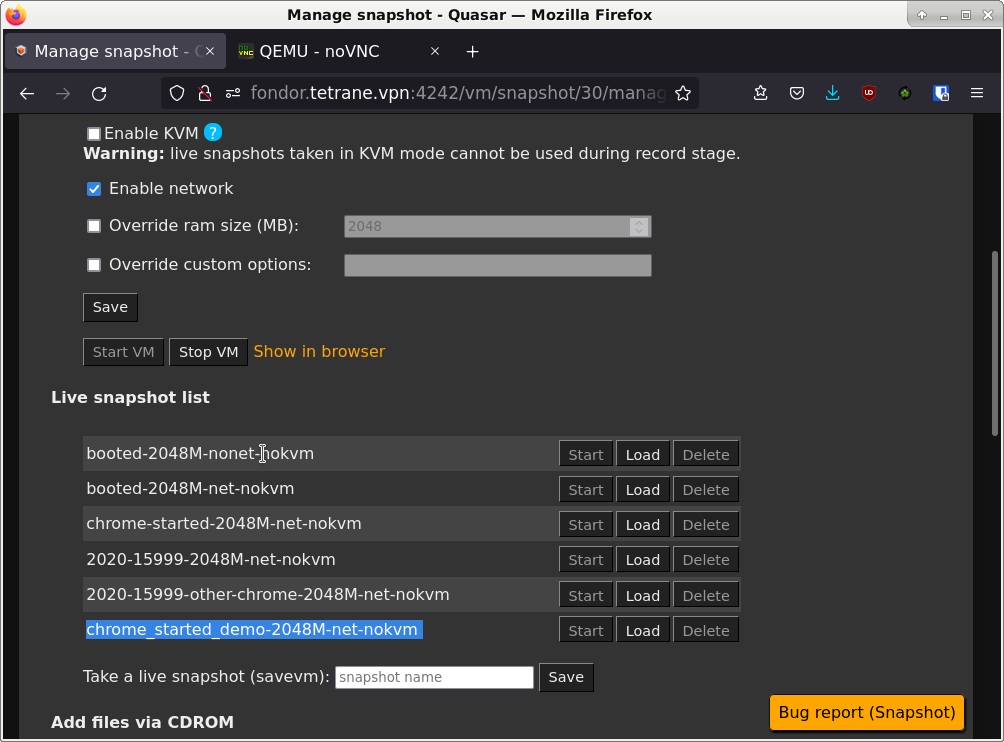
1.3. Important: Taking a live snapshot
When the VM is ready, it is critical that we take a live snapshot with Chrome started, in order to be able to take multiple records with stable addresses. While ensuring stable addresses between records is generally made superfluous by the timeless analysis capabilities of REVEN, using the GDB recording technique actually requires them.
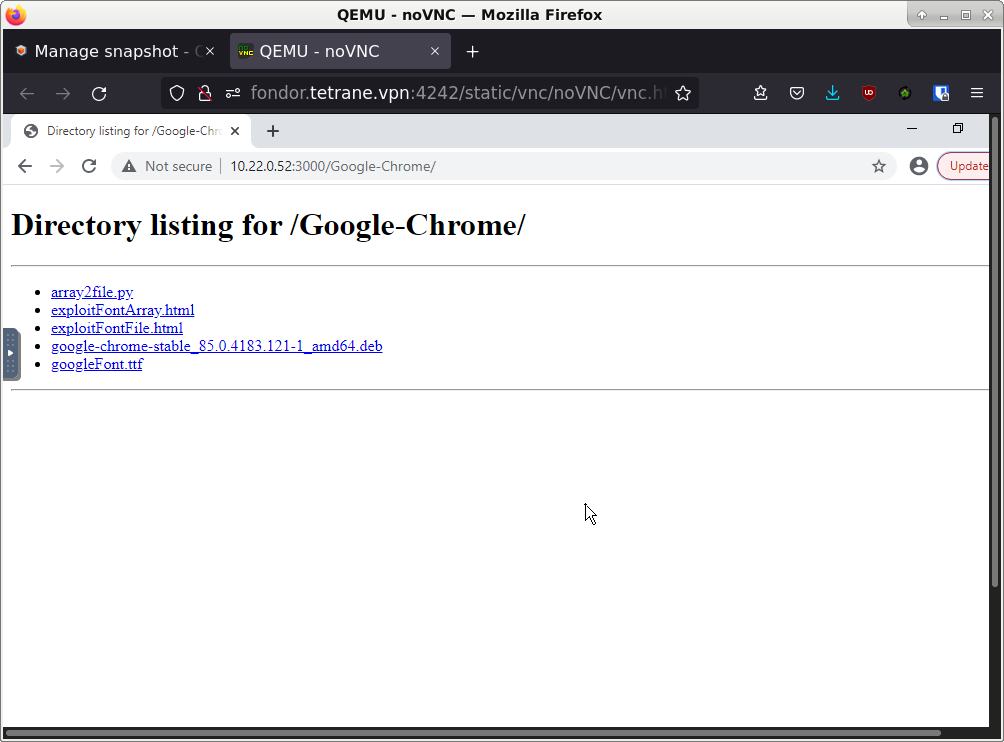
1.4. Make a short scenario executing the target binaries
Our target binaries are chrome.dll and ntdll.dll. The latter has a high chance of being executed in any scenario we’d take, so let’s focus on the former. A good way to ensure it is executed is to click on one of the links displayed in the tab that is connected to the remote directory containing the exploit files. Crucially, we don’t need to wait for the requested page to be loaded after clicking the link, and we should hurry as much as possible to stop the scenario after clicking the link. We can then replay the scenario as normal. To go as fast as possible, one can disable in the replay page the Memory History feature, that is not needed for finding the addresses.
1.5. Finding the addresses of the functions of interest.
After finishing the replay of the scenario, let’s use the Python API to find our addresses of interest:
In [0]: def find_address_of_symbol(server, binary_path, symbol_pattern):
   ...:     binary = next(server.ossi.executed_binaries(binary_path))
   ...:     # Find the first context where the binary has been executed in the trace.
   ...:     # This is why we require a scenario where the target binary has actually been executed.
   ...:     ctx = next(server.trace.search.binary(binary))
   ...:     base_address = ctx.ossi.location().base_address
   ...:     symbol = next(binary.symbols(symbol_pattern))
   ...:     return base_address + symbol.rva
   ...:
In [1]: hex(find_address_of_symbol(server, "chrome.dll", "^net::HttpBasicStream::SendRequest$"))
Out[1]: '0x7fff36d4db50'
In [2]: hex(find_address_of_symbol(server, "system32/ntdll.dll", "^KiUserExceptionDispatch$"))
Out[2]: '0x7fff4f8bfde0'
All done, let’s go to use GDB!
2. Starting the VM in GDB mode, and attaching GDB to the VM
2.1. Starting the VM in GDB mode
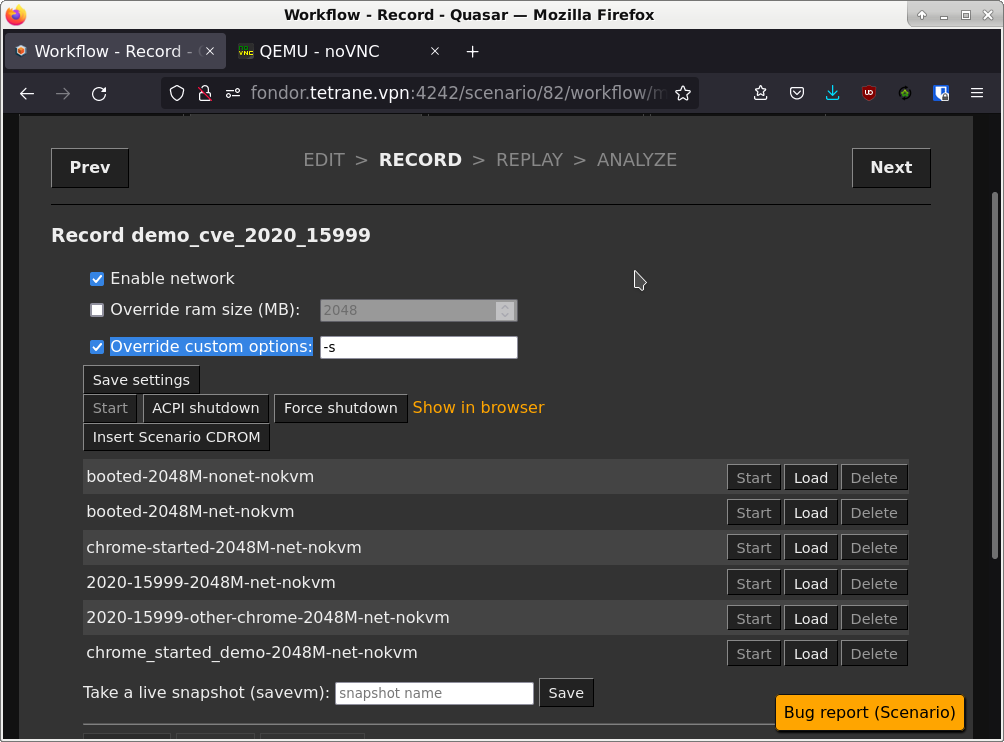
Create a new scenario on the same disk snapshot, then on the record page check the “Override custom options” checkbox.
In the input field, enter the -s option to enable attaching GDB to the VM.
Then start the VM with the live snapshot you took in step (1.3).
2.2. Starting GDB
Start GDB and attach it to the VM:
; gdb
(gdb) target remote host:1234
The host is the host where the VM is running (if your REVEN installation is on your current machine, it is typically localhost). The port is always 1234.
At this point the VM to which you attached GDB should be frozen, waiting for GDB to let it continue.
3. Using GDB to record the scenario
3.1. Starting the record
Add the breakpoint to net::HttpBasicStream::SendRequest in GDB:
(gdb) b *0x7fff36d4db50
Breakpoint 1 at 0x7fff36d4db50
Then call the continue GDB command to let the VM run until it hits that breakpoint:
(gdb) continue
Continuing.
Lastly, inside of the running VM, click the link to the file that will trigger the exploit.
The VM should freeze again and GDB should report:
Breakpoint 1, 0x00007fff36d4db50 in ?? ()
You can then click the Start button in the Project Manager to start the record. You can take your time, since the VM is stopped, the record will not grow in size.
3.2. Performing the record
Delete your initial breakpoint (so that another call to SendRequest doesn’t freeze the VM again), and add the breakpoint to ntdll.dll!KiUserExceptionDispatch:
(gdb) del br 1
(gdb) b *0x7fff4f8bfde0
Breakpoint 2 at 0x7fff4f8bfde0
Then, simply resume the session in GDB to record the part that interests us:
(gdb) continue
Continuing.
After a short while, you should see:
Breakpoint 2, 0x00007fff4f8bfde0 in ?? ()
There, we reached the second breakpoint. If you want to make sure that ntdll.dll!KiUserExceptionDispatch will be present in the trace, you can add a few more instructions to the record with stepi:
(gdb) stepi
(gdb) stepi
(gdb) stepi
We can now press the Stop and Commit buttons in the Project Manager to finalize our record! Again, since the VM is stopped, there is no need to rush here.
4. Replaying the scenario
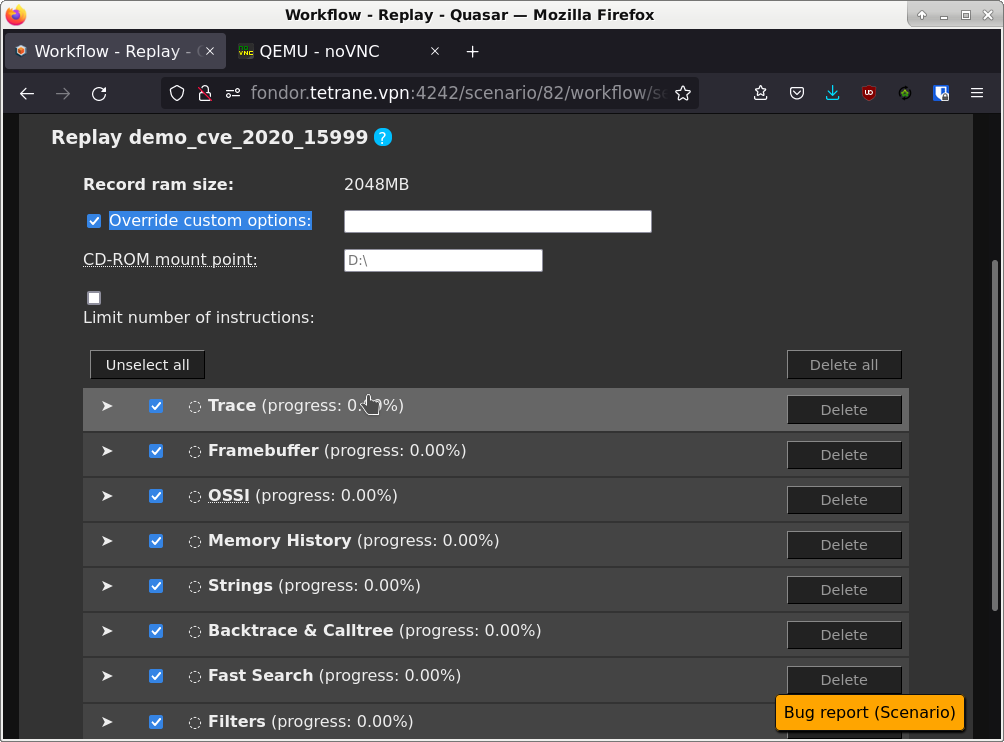
You can replay the scenario as normal, excepted that you have to override the custom options in the replay page, in order to remove the -s option that is added here by default since it was present at record time.
If you fail to do so, your replay will fail. If that happens to you, simply delete the few resources that replayed successfully (by using the delete all button) and try again after removing the custom option (the checkbox must be checked and its input field empty).
Conclusion
Here is a small video summarizing the record replay with GDB (after having recovered the addresses of interest):
Applying this technique, we were able to record CVE-2020-15999 in under 230 million instructions, whereas manually controlled records were in the ballpark of the billion instructions at the smallest. It is also significantly easier to perform as we can take our time between each step, without a risk of failing the record.
Of course, using this GDB client has drawbacks when it is not complemented by the automatic recording options provided in the Enterprise edition:
- No way to fully automate the workflow using a Python API.
- Some of us prefer the interface of other debuggers :-).
- More substantially, the GDB client has no access to the OSSI for the emulated VM, and so no knowledge of processes, binaries or symbols inside of the VM. This leads to you having to perform multiple GDB sessions and records to write down the useful addresses beforehand and hoping they remain stable so that you can then put your breakpoints at the relevant addresses. This can be made somewhat easier by using live snapshots, like we did in this walkthrough.
We plan to ship some ergonomic improvements to make this GDB connection more visible and easier to use in a future version of REVEN, and we also have a bigger project involving the ability to use a fully informed debugger to drive the record, so stay tuned ;-)!
