


ALL-IN-ONE PLATFORM
esDynamic
Manage your attack workflows in a powerful and collaborative platform.
Expertise Modules
Executable catalog of attacks and techniques.
Infrastructure
Integrate your lab equipment and remotely manage your bench.
Lab equipments
Upgrade your lab with the latest hardware technologies.


PHYSICAL ATTACKS
Side Channel Attacks
Evaluate cryptography algorithms from data acquitition to result visualisation.
Fault Injection Attacks
Laser, Electromagnetic or Glitch to exploit a physical disruption.
Security Failure Analysis
Explore photoemission and thermal laser stimulation techniques.


EXPERTISE SERVICES
Evaluation Lab
Our team is ready to provide expert analysis of your hardware.
Starter Kits
Build know-how via built-in use cases developed on modern chips.
Cybersecurity Training
Grow expertise with hands-on training modules guided by a coach.


ALL-IN-ONE PLATFORM
esReverse
Static, dynamic and stress testing in a powerful and collaborative platform.
Extension: Intel x86, x64
Dynamic analyses for x86/x64 binaries with dedicated emulation frameworks.
Extension: ARM 32, 64
Dynamic analyses for ARM binaries with dedicated emulation frameworks.
DIFFERENT USAGES
Penetration Testing
Identify and exploit system vulnerabilities in a single platform.
Vulnerability Research
Uncover and address security gaps faster and more efficiently.
Malevolent Code Analysis
Effectively detect and neutralise harmful software.
Digital Forensics
Collaboratively analyse data to ensure thorough investigation.


EXPERTISE SERVICES
Software Assessment
Our team is ready to provide expert analysis of your binary code.
Cybersecurity training
Grow expertise with hands-on training modules guided by a coach.

INDUSTRIES
Semiconductor
Security Labs
Governmental agencies
Academics

ABOUT US
Why eShard?
Our team
Careers


FOLLOW US
Linkedin
Twitter
Youtube
Gitlab
Github


Detecting Use-After-Free vulnerabilities using esReven

eShard’s Timeless Debugging and Analysis (TDnA) allows to capture a time slice of the execution of a system (CPU, Memory, Hardware Events) and provides some powerful analysis features that speed up and scale the reverse engineering process. It can be combined with various fuzzing approaches that will drive the discovery of relevant scenarios.
The main benefit of TDnA is to observe the system once, then to be able to analyze it in stable conditions and in as many directions as desired with high-level algorithms such as backward/forward data tainting. In this article, we present some approaches to tackle the UAF detection problem with eShard’s esReven, TDnA platform which is a commercially available solution.
The result is an operational Jupyter notebook that was field tested with esReven against some actual vulnerabilities from the Common Vulnerabilities and Exposures (CVE) list, among which BlueKeep (CVE- 2019-0708). More generally, our implementation can report UAF vulnerabilities whether they trigger a crash or not, in both user and kernel space. We present an analysis of our results in terms of performance and accuracy and suggest future developments.
A Jupyter notebook using the esReven Python API is available on Github and implements this approach.
Context and Motivation
Use-After-Free vulnerabilities
Use-After-Free (UAF) is an important class of exploitable vulnerabilities whose prevalence increased a lot in recent years, especially in web browsers (1) , where a successful exploitation could lead to catastrophic consequences.
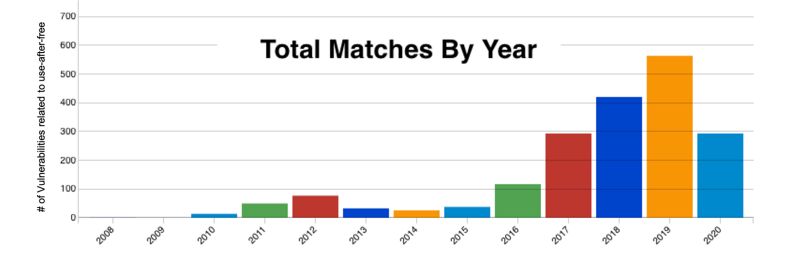 (source: NIST)
The esReven timeless debugging and analysis platform
esReven's capabilities should come at no surprise to the readers of this blog. From the recording of a scenario in a VM, aka a use case, esReven generates a corresponding execution trace and provides a panel of views, analysis algorithms and tools.
At any time in the trace, esReven allows to observe the CPU context, the Backtrace and the Memory content. Other features include following all memory accesses in time and searching for manipulated strings, called symbols and arbitrary patterns in memory.
Last but not least, taint analysis allows to follow data flow forward and backward, enabling crash-to-data and data-to-crash analysis. All these features are available both via a graphical user interface for interactive analysis, and a Python API for automating the debugging and analysis.
Detecting UAF using esReven
The UAF detection capabilities of esReven currently come under the form of a Jupyter notebook that uses esReven’s Python API. While elaborate, the notebook was developed entirely using user-facing API entries, meaning that the ability to develop this kind of analysis is available to all esReven users. The notebook can also be converted to a regular Python script for full automation of the analysis process in the esReven workflow.
The notebook has a dedicated cell for users of the UAF algorithms to specify the algorithm’s parameters. Here are the important categories:
-
Server connection: information to connect to the esReven scenario on which the analysis should be performed.
-
Allocator control: the UAF algorithm needs to understand allocators to detect UAF. These parameters allow to choose which of the default-supported allocators (one system, one user) should be taken into account.
-
Search control: in this category, several parameters allow to control which part of the execution trace is explored by the algorithm, to improve the performance and relevance of the algorithm:
-
Range control: a esReven trace can contain billions of instructions, so if the user has a specific target in mind they can restrict the algorithm to a range of instructions of interest.
-
Filter control: allows to restrict the search to a certain process or binary.
-
Address control: in its default mode, the UAF algorithm will look for UAF on any address allocated in the search space. The address control parameter allows to set a specific address and check for the presence of UAF only for this single address.
-
Once the parameters are set in the dedicated cell, the users of the notebook will obtain the results of the algorithm by running all the cells of the notebook. The results will appear in the last cell of the notebook. The time required for various steps of the algorithm will be displayed in the cells corresponding to these steps.
The rest of this section presents the general algorithm used to detect UAF vulnerabilities and details how the alias analysis is performed in the final notebook, as well as one variant that was considered during development.
Outline of the algorithm
The algorithm relies on two steps:
-
Find allocation/deallocation pairs.
-
For each pointer associated to an allocation/deallocation pair, look for uses after the deallocation.
The uses of an allocated pointer after its deallocation constitutes a UAF, by definition.
Note that in this approach, and contrary to existing approaches like VulnScan (2), UAF vulnerabilities can be detected even if they do not lead to an access violation error.
Finding allocation/deallocation pairs
Finding allocation/deallocation pairs is a simple matter of using the fast symbol call search feature of esReven to find the calls to the specific symbols that correspond to the desired allocator’s allocation and deallocation functions.
# looking for malloc calls
if search_malloc:
    def filter_in_realloc(location, caller_location):
        return location.binary == caller_location.binary and caller_location.symbol.name == "realloc"

    # Search for allocations with malloc
    for symbol in server.ossi.symbols(r'^_?malloc$', binary_hint=r'msvcrt.dll'):
        retrieve_events_for_symbol(alloc_dict, AllocEvent, symbol, retrieve_alloc_info_with_size_as_first_argument, filter_in_realloc)
Then, for each call, one must inspect the trace context to extract the parameters (desired allocation size, pointer to free) and the return value (freshly allocated pointer).
# looking for malloc parameters and return value
def retrieve_alloc_info_with_size_as_first_argument(ctx_begin, ctx_end):
    return (
        retrieve_return_value(ctx_end),
        retrieve_first_argument(ctx_begin)
    )

def retrieve_first_argument(ctx):
    if ctx.is64b():
        return ctx.read(reven2.arch.x64.rcx)
    else:
        esp = ctx.read(reven2.arch.x64.esp)
        return ctx.read(reven2.address.LogicalAddress(esp + 4, reven2.arch.x64.ss), 4)
The UAF notebook supports the user-space malloc allocator, and ExAllocatePoolWithTag that is notably used in the kernel. The algorithm can easily be customized to support other allocators, following those steps:
-
Add the set of symbols corresponding to the various allocation (e.g. malloc, calloc, realloc) and deallocation (e.g. free, realloc again) function symbols to the set of searched symbols.
-
For each such function, describe how to get the relevant parameters from a trace context at the beginning of a call to the function, and how to get the return value from a trace context at the end of a call to the function.
The collected allocation/deallocation pairs are stored in a dictionary that maps each allocated address to its list of allocation/deallocation pairs.
Whole-trace search of aliases in memory
For looking for uses after the deallocation, a first approximation is to use the whole-trace search in memory feature of esReven to look for aliases in memory of the pointer. If any such alias is stored in memory after the deallocation, then this indicates a potential UAF.
# Example of code to find potential UAFs from a malloc/free pair of transitions
# Get a search object
search = server.trace.search

# Search the address in memory, from malloc to free + post_free_tr_size
for event in search.memory(pattern,
                           server.trace.context_before(start_tr),
                           server.trace.context_before(end_tr + post_free_tr_size)).events():

   # An event occurs on the pattern (alias) after the free
   if (event.transition is not None and
       event.transition.id > end_tr and
       event.transition.id < end_tr + post_free_tr_size):
      sym_name = event.transition.context_before().ossi.location().symbol.name

      # And match was created before the free
      if (event.match.creation_transition is not None and
          event.match.creation_transition.id < end_tr):
         # So we should have an AccessEvent type event
         if isinstance(event, reven2.search_in_memory.AccessEvent):
            if not in_allocator_code(server, event):
               print(event.match)
               print(event,  "Distance from free:", (event.transition.id - end_tr))
               print(sym_name)
               uaf_count = uaf_count + 1
Of course this first approach is neither sound nor complete:
-
It will report potential UAFs for the discovered aliases even if they are not actually reused after the deallocation, just stored.
-
It will miss potential UAF for aliases that are only stored in registers and used from there.
-
Since only the returned pointer is searched for, internal pointers to allocated objects will be missed too. Alledgedly it would be possible to search for all addresses in the range of an allocated object, but this multiplies the number of searches by the average size of the allocated objects, which can be quite big).
-
Albeit unlikely, false positive could occur if values in memory happen to match the address of the allocated pointer.
-
The approach relies on virtual address, which in the context of system-wide execution traces, may lead to collisions.
Still, the approach allowed to detect UAF in an exploit for CVE-2018-11529, a use-after-free vulnerability in VLC media player that was previously analyzed with esReven.
Taint-based use analysis
In order to remove the above shortcomings, a second approach was followed, using the taint feature of esReven in order to detect UAF from the allocation/deallocation pairs.
A second approach to detect UAF from the allocation/deallocation pairs is to use the taint feature of esReven.
Taint analysis in esReven
The taint analysis is a major feature of esReven that is instrumental in many use cases, such as going from the crash to the buffer responsible for the crash, or from a buffer to user input.
The taint analysis in esReven works forward (“What data depends on this tainted data?”) or backward (“Where does this tainted data come from?”).
Internally, the taint only uses physical addresses rather than virtual addresses, which is essential to seamlessly taint between processes and execution levels without stumbling on process or user/kernel boundaries. To lift w86_64 instructions to LLVM IR, the taint process relies on the open-source project remill, and then a custom algorithm propagates the information on the LLVM IR.
During normal operation, esReven’s taint analysis synergizes with the memory history feature of esReven, that allows to very efficiently query the list of accesses to a given range of memory, in order to skip tainting until the next tainted memory address is accessed, in case where only memory is tainted (and no register) is tainted.
Taint-based use analysis algorithm
The outline of the algorithm is the following:
- For each allocation/deallocation pair, taint forward the return value of the allocation function (e.g. malloc), and then follow the taint until reaching the portion of the execution trace that corresponds to the deallocation function (e.g. free).
# def start_alloc_address_taint(server, alloc_event, free_event), first part
 # Setup the first taint [alloc; free]
 tainter = reven2.preview.taint.Tainter(server.trace)
 taint = tainter.simple_taint(
     tag0="rax" if alloc_event.tr_end.context_before().is64b() else "eax",
     from_context=alloc_event.tr_end.context_before(),
     to_context=free_event.tr_begin.context_before() + 1,
     is_forward=True
 )
- Skip tainting the deallocation function, in order to avoid tainting the internals of the allocator, which would yield false positives. The pointer argument to the deallocation function (generally, the first argument to this function, stored in the rcx register on 64-bit Windows) should also be untainted for the same reason.
# def start_alloc_address_taint(server, alloc_event, free_event), second part
 # Setup the second taint [free; [
 state_before_free = taint.state_at(free_event.tr_begin.context_before())

 # `rcx` is lost during the execution of the free in theory
 # `rsp` is non-useful if we have it
 tag0_regs = filter(
     lambda x: x[0].register.name not in ['rcx', 'rsp'],
     state_before_free.tainted_registers()
 )

 # We don't want to keep memory inside the allocated object as accessing them will trigger a UAF anyway
 # It is also used to remove some false-positive because the memory will be used by the alloc/free functions
 tag0_mems = filter(
     lambda x: not alloc_event.memory_range.is_physical_address_range_in_translated_pages(x[0].address.offset, x[0].size),
     state_before_free.tainted_memories()
 )

 # Only keep the slices
 tag0 = map(
     lambda x: x[0],
     itertools.chain(tag0_regs, tag0_mems)
 )

 tainter = reven2.preview.taint.Tainter(server.trace)
 return tainter.simple_taint(
     tag0=list(tag0),
     from_context=free_event.tr_end.context_before(),
     to_context=None,
     is_forward=True
 )
- Resume the taint after the deallocation function and check for each instruction touched by the taint if the tainted instruction is a memory access to the allocated object.
for (alloc_event, free_event) in get_alloc_free_pairs(alloc_events, errors):
     # Taint resumed after free
     taint = start_alloc_address_taint(server, alloc_event, free_event)

     for access in taint.accesses(changes_only=False).all():
         ctx = access.transition.context_before()
         mode = mode_64 if ctx.is64b() else mode_32
         cs_insn = next(md.disasm(access.transition.instruction.raw, access.transition.instruction.size))

         # Skip `lea` instructions are they are not really memory read/write and the taint
         # will propagate the taint anyway so that we will see the dereference of the computed value
         if cs_insn.mnemonic == "lea":
             continue

         registers_in_state = {}
         for reg_slice, _ in access.state_before().tainted_registers():
             registers_in_state[reg_slice.register.name] = reg_slice

         for cs_op in cs_insn.operands:
             if cs_op.type != capstone.x86.X86_OP_MEM:
                 continue

             uaf_reg = None

             if cs_op.value.mem.base != 0:
                 base_reg_name = cs_insn.reg_name(cs_op.value.mem.base)
                 if base_reg_name in registers_in_state:
                     uaf_reg = registers_in_state[base_reg_name]

             if uaf_reg is None and cs_op.value.mem.index != 0:
                 index_reg_name = cs_insn.reg_name(cs_op.value.mem.index)
                 if index_reg_name in registers_in_state:
                     uaf_reg = registers_in_state[index_reg_name]

             if uaf_reg is None:
                 continue

             dereferenced_address = compute_dereferenced_address(ctx, cs_insn, cs_op)

             dereferenced_physical_address = reven2.address.LogicalAddress(dereferenced_address).translate(ctx)

             if dereferenced_physical_address is None:
                 continue

             if not alloc_event.memory_range.is_physical_address_range_in_translated_pages(dereferenced_physical_address.offset, 1):
                 continue

             report_uaf(physical_address, alloc_event, free_event, uaf_reg, dereferenced_address, ctx.ossi.location())
- Each tainted instruction that performs a memory access to the allocated buffer exhibits a semantic dependence between the memory access and the allocation, i.e. the access is made either from the pointer originally returned by the allocation or a pointer built from this original pointer. It is then safe to conclude that such accesses constitute UAF.
Memory history optimization
As an optimization, it is generally possible to intersect the set of tainted instructions with the set of instructions that perform access to the allocated object in memory, using the memory history feature of esReven. This comes on top of the normal memory history optimization that already occurs in the taint. In esReven, recovering the data of the tainted instructions is much slower than querying the memory history, so this optimization results in a speed-up in performance of up to 7 times. Unfortunately, this optimization is not possible in general, because the operating system does not always return a virtual buffer that is fully mapped from an allocation function, and the memory history feature works with physical addresses, not virtual addresses.
Note that the approach of using taint analysis to detect UAF vulnerabilities has prior art, such as Undangle (1), but to our knowledge this is the first time that such an approach is implemented in a timeless analysis platform, especially a system-wide one.
Results and Discussion
The UAF detection algorithm based on the taint analysis detected UAF vulnerabilities on an exploit for CVE-2018-11529 (user space) and on a PoC for CVE-2019-0708 (BlueKeep, a kernel UAF vulnerability on Remote Desktop Protocol which allowed remote code execution without authentication on Windows 7), that was previously analyzed on our blog too.
Both of these execution traces contain more that one billion instructions, with CVE-2018-11529 even totalling 4,777,912,598 instructions.
The remainder of this section discusses the results obtained along several axes.
Performance
Since this article, esReven performance has been greatly improved resulting in an up to x17 speedup in the UAF detection algorithm. Look at this article
The two main steps of the algorithm were measured separately. They also depend on the input parameters, since these parameters can restrict the number of addresses to analyze.
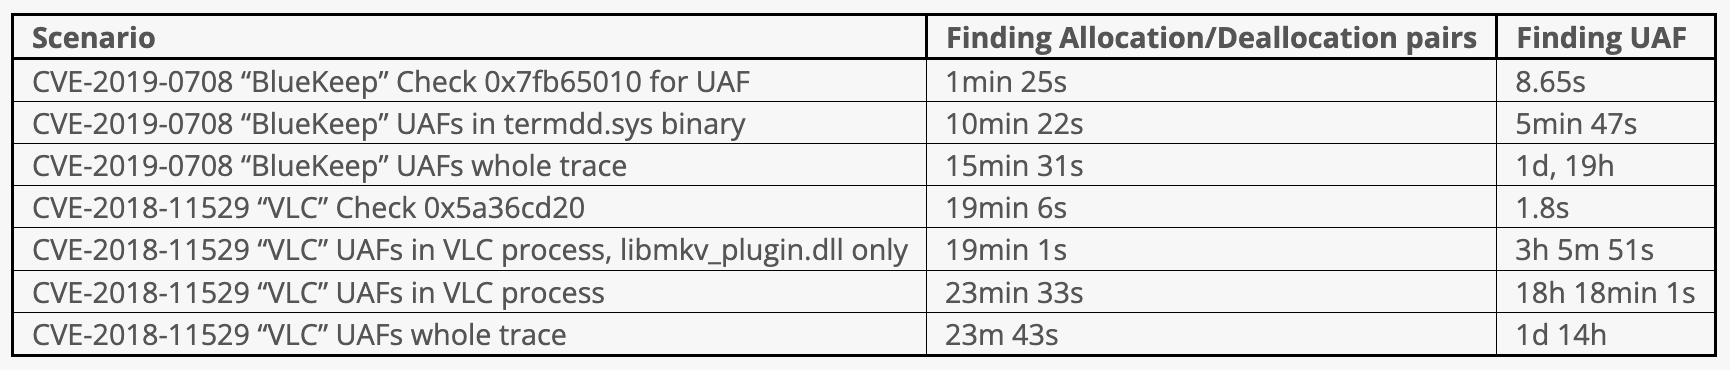
Note that there is still plenty of room for improvement, performance-wise. For example, the taint process, in which the algorithm currently spends most of its time, can be optimized by trimming some branches that cannot lead to UAF.
Accuracy
Similarly to the performance, the accuracy depends on the input parameters.
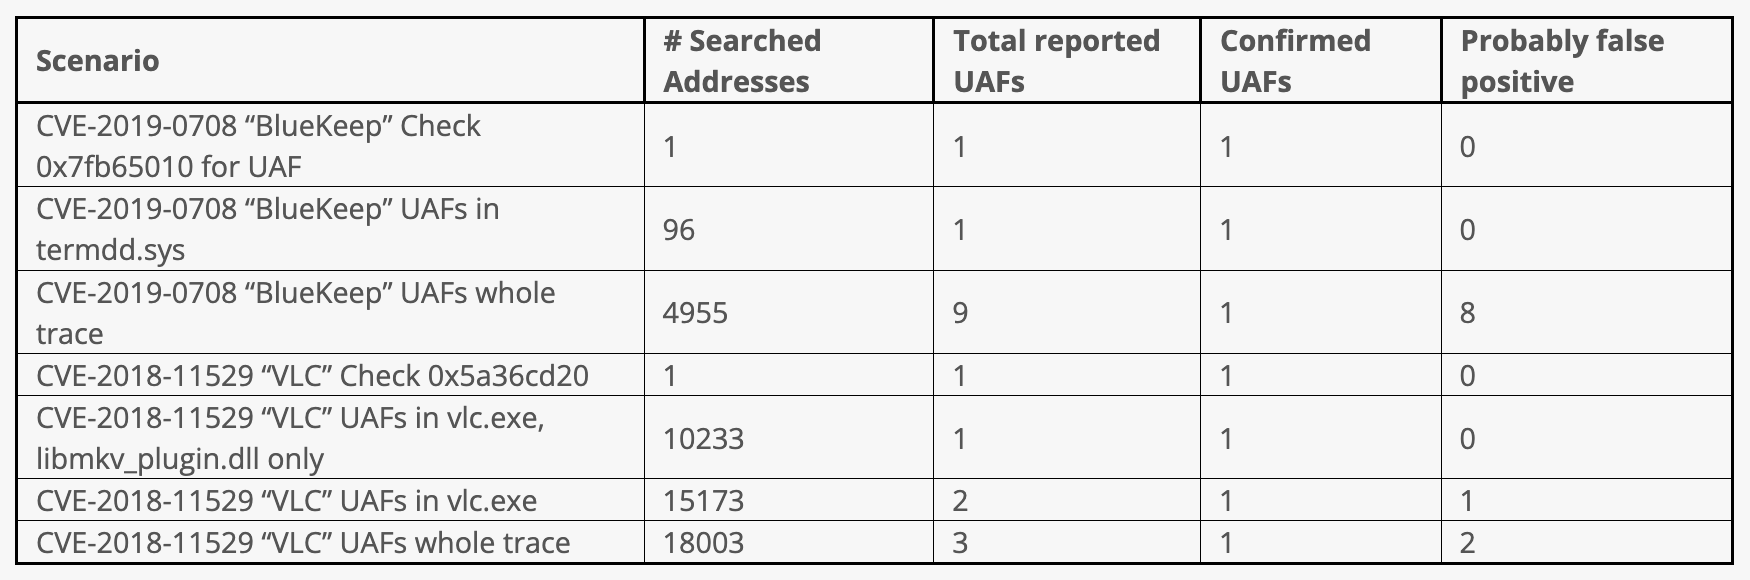
While each false positive could not be studied in details yet, it appears that they mostly come from the mismatch between the general taint propagation semantic and the “pointer aliasing semantic” that is required for UAF detection. The default taint analysis is not conservative enough to only track pointers, leading to a form of “overtaint”, and thus the false positives.
As an example, consider the following pseudo-code, simplified from a real execution trace:
void* begin_buffer = malloc(N*sizeof(T));
// [...]

size_t used_count = get_vector_size(begin_buffer);

// end_buffer gets tainted: it is indeed an alias of begin_buffer
void* end_buffer = begin_buffer + used_count * sizeof(T);

// [...]

// used_count gets tainted: this is overtaint, as used_count is not a pointer, and thus not an alias
size_t used_count = (end_buffer - begin_buffer) / sizeof(T);

void* fresh_begin_buffer = malloc(N * 2 *sizeof(T));
memcpy(fresh_begin_buffer, begin_buffer, used_count);
free(begin_buffer);

// [...]

// fresh_end_buffer gets tainted due to the taint on used_count: this is overtaint
void* fresh_end_buffer = fresh_begin_buffer + used_count;
To fix these false positives, the taint semantic should be restricted to only propagate between pointers. This could be done in the proposed notebook using rules similar to those presented in section 3.2. of the Undangle (1) paper, but is currently future work.
We have no false negatives to report at the time of writing, but due to their nature these are harder to detect.
Usability
It is important for the algorithm to be usable easily by reverse engineers, without having to delve into the working of the algorithm.
The interface of the notebook relies on only a handful of parameters, which make applying the algorithm to a handful of situations practical (system UAF somewhere in a trace, localized UAF in a user space process, checking a single address).
Executing the notebook is pretty simple, look at this short video.
Perimeter
The algorithm itself is fairly independent from operating systems (OS) and processor word size (32 or 64-bit). The constraint is on the allocator, in that to extend the notebook to other OSes and programs with their custom allocators, the user has to add support for the allocators to be analyzed.
How to add a custom allocator has been described in a previous section of this article.
Comparison to existing approaches
Static detection
Static UAF detection is notoriously hard (3), in particular due to:
-
There is no easy “pattern” to detect, like in buffer overflow or string format vulnerabilities.
-
UAF relies on a sequence of events to detect (allocation, free, and then the use after free), which means there must be some kind of “memory” to the algorithm. While this is given naturally by dynamic algorithms, in static contexts this is harder to express.
-
For usefulness, the algorithm must support custom allocators. Describing the semantics of allocators statically may not be easy.
-
Scaling is hard.
At the source level, subsets are provable for programs written in some specific fashion, such as with reference being annotated with the lifetime of objects (like with Rust’s borrow checker). However, this is more of a preventive measure and doesn’t help for the sea of programs already written without such annotations.
The advantage of static detection over dynamic detection such as esReven’s, is that detection does not depend on the execution of a particular path. The drawback of such detection is that, without executing the program, and in the absence of lifetime annotations, the static analysis is necessarily conservative, meaning that it will reject valid programs, or in other words yield unfixable false positives. Depending on the way a specific program was written or compiled, the amount of false positives can render the approach unsustainable.
GUEB is, to our knowledge, the only available binary-level static detector for UAF.
Online approaches
While both timeless analysis and “online approaches” are dynamic approaches, in online approaches the program or system to analyze is instrumented while it is running to look for UAF. This category contains software well known by system developers, such as Valgrind’s memcheck, and also for example Undangle (1).
Dynamic approaches in general have the advantage of not having to be conservative, meaning they can greatly limit the number of false positives. However, they are not complete, in that they typically work on a single path of execution, which may miss some UAF that are not exercised by this particular path.
Online approaches add additional constraints on the program or system under analysis, that are not applicable to esReven’s timeless approach:
-
It is intrusive, because it has to modify the system under analysis. In some cases, this could lead to UAF not being present, or being introduced only because of the added instrumentation
-
It slows down execution: this can, too, have impacts on the execution, for example by causing network timeout that would not happen on the uninstrumented version of the system
-
It is difficult to combine with other analyses: due to the other factors (intrusiveness, performance degradation), it is typically difficult to instrument a single execution of a system to perform multiple analyses on it. For UAF that do not happen deterministically, it can make analysis of the root cause of UAF more complex. With timeless analysis, it is possible to perform first UAF detection, and then root cause analysis on the same execution that was recorded once.
Concolic and fuzzing approaches
A third category of UAF detectors are the concolic (concrete-symbolic) and fuzzing approaches, whose general purpose is to keep the precision and performance (relative to static analysis) of dynamic analysis, while expanding the number of paths it covers, and hence its correctness.
A recent example of this category is UAFuzz (4), which uses directed fuzzing to produce inputs for reproducing bugs caused by UAF.
Such an approach is very interesting, and in theory could be combined with the timeless analysis approach, so that a given execution that is successful in reproducing the bug can be efficiently analyzed to understand the root cause of the UAF.
esReven can be combined with a fuzzer using its scenario autorecord features to automatically record and then analyze scenarios from the output of a fuzzer.
Conclusion
In this article, we presented our research work applying UAF detection to a TDnA platform. The proposed detection algorithm in its current shape is already usable on several real-world CVEs and available online for use with esReven.
Future work could be directed to improving performance and removing the reported false positives, as well as to the detection of vulnerabilities, such as buffer overflow detection, race condition detection, or different categories of analyses, such as file activity report or Windows registry activity report.
As illustrated by this research, esReven is a toolbox that contains a lot of useful features leveraging the full knowledge of the execution trace provided by the TDnA technology, and mixing these features allow to build powerful algorithms, such as vulnerability detection algorithms. The esReven Python API, which exposes these features, makes doing so especially practical for (somewhat dedicated) users.
(co-written by Louis Dureuil, Quentin Buathier & Benoit Brodard)

Footnotes
-
(1) Juan Caballero, Gustavo Grieco, Mark Marron, and Antonio Nappa. 2012. Undangle: early detection of dangling pointers in use-after-free and double-free vulnerabilities. In Proceedings of the 2012 International Symposium on Software Testing and Analysis (ISSTA 2012). Association for Computing Machinery, New York, NY, USA, 133–143. DOI: https://doi.org/10.1145/2338965.2336769
-
(2) swiat. VulnScan – Automated Triage and Root Cause Analysis of Memory Corruption Issues (https://msrc-blog.microsoft.com/2017/10/03/vulnscan-automated-triage-and-root-cause-analysis-of-memory-corruption-issues/), retrieved on 2020-12-08
-
(3) Josselin Feist, Laurent Mounier, Marie-Laure Potet. Statically Detecting Use After Free on Binary Code. In GreHack 2013 (http://grehack.org/files/2013/talks/talk_34_Feist-_Statically_Detecting_Use_After_Free_on_Binary_Code-grehack.pdf), retrieved on 2020-12-09
-
(4) Manh-Dung Nguyen, Sébastien Bardin, Richard Bonichon, Roland Groz, and Matthieu Lemerre. Binary-level Directed Fuzzing for Use-After-Free Vulnerabilities. arXiv preprint arXiv:2002.10751 (2020).


