

Announcing REVEN version 2.10
Discover Timeless Analysis Live.
Tetrane is pleased to announce the release of REVEN Enterprise and REVEN Professional 2.10.
REVEN is a Timeless Debugging and Analysis (TDnA) Platform designed to go x10 faster & x10 deeper while reverse engineering. Technically, REVEN captures a time slice of a full system execution (CPU, Memory, Hardware events) to provide unique analysis features, such as Memory History or forward/backward data flow Taint, that speed up and scale the reverse engineering process.
People use REVEN for vulnerability analysis, malware analysis, software discovery, exploration of Windows or Linux kernel mechanisms, etc.
Here are a few examples of what can be achieved with REVEN: analyze a Chrome CVE, detect interprocess use of uninitialized memory, find uses of cryptographic functions and the encrypted data, compare traces, trace network data back to encryption, automate recordings and analysis, analyze non-deterministic crashes.
REVEN version 2.10 brings many improvements to the table, such as a smoother first-time user experience, process and ring filters in the API, the new function prototype API and more on the OSSI front.
This article covers these new features and tools and the other important changes introduced in the REVEN 2.10 release.
Contents
- Smoother experience for first-time users
- Filter by process/ring with the Filter API
- Work with a call’s arguments and return value with the Prototypes API
- Faster analysis (x2 to x17 in end-user scripts)
- More OSSI
- And More
Smoother experience for first-time users
As a first-time user of REVEN, version 2.10 eases further your first steps so that you can walk through the installation and the record of your first scenario faster than ever.
We changed the default options to be more convenient and push first-time users towards the fast path. For example, we pre-populate the list of PDB servers with some common names, and all of REVEN’s clients (VMs, GUI, Python API) are now preconfigured to be usable in a browser out-of-the-box.
The revamped [installation documentation](https://doc.tetrane.com/professional/2.10.0/Installation/Index.html{:target=”_blank”} and the brand new Quick start guide will guide you through the installation and first use of REVEN, from the moment you download your package to the analysis of your first scenario!
Filter by process/ring with the Filter API
Available from the GUI since REVEN version 2.7, the ability to filter on a set of processes and only keep userspace or kernelspace instructions makes it easier to analyze REVEN scenarios by focusing on what is of interest to the analyst.
With REVEN 2.10, this can now be achieved using the Python API.
Want to limit the analysis to the chat server and clients in the tokio_chat scenario?
You can start by requesting the list of executed processes containing “chat” in their name:
>>> processes = list(server.ossi.executed_processes("chat"))
>>> for process in processes:
...     print(process)
chat_client.exe (2832)
chat_server.exe (648)
chat_client.exe (2816)
From there, we can filter on this list of processes with the desired ring policy:
>>> for ctx_range in server.trace.filter(processes, reven2.filter.RingPolicy.R3Only):
...     # each ctx_range is a range of contexts that are filtered in
...     # here, we fetch the first context of the range, and then print the location at this context
...     first_context = next(iter(ctx_range))
...     print(f"{ctx_range}: {first_context.ossi.process()}\t| {first_context.ossi.location()}")
[Context before #5662909, Context before #5669296]: chat_client.exe (2816)	| ntdll!ZwDeviceIoControlFile+0x14
[Context before #5670173, Context before #5671124]: chat_client.exe (2816)	| ntdll!NtSetIoCompletion+0x14
[Context before #5672523, Context before #5673027]: chat_client.exe (2816)	| ntdll!NtRemoveIoCompletionEx+0x14
[Context before #5678502, Context before #5678522]: chat_client.exe (2816)	| chat_client!<tokio_timer::clock::clock::Clock as tokio_timer::timer::now::Now>::now+0x24
[Context before #5678723, Context before #5679392]: chat_client.exe (2816)	| ntdll!ZwQueryPerformanceCounter+0x14
...
We can even filter in reverse, starting from the end of the recorded scenario!
>>> for ctx_range in server.trace.filter(processes, reven2.filter.RingPolicy.R3Only, is_forward=False):
...     # each ctx_range is a range of contexts that are filtered in
...     # here, we fetch the first context of the range, and then print the location at this context
...     first_context = next(iter(ctx_range))
...     print(f"{ctx_range}: {first_context.ossi.process()}\t| {first_context.ossi.location()}")
[Context before #6792905, Context before #6792735]: chat_client.exe (2832)	| ntdll!NtRemoveIoCompletionEx+0x12
[Context before #6792534, Context before #6791916]: chat_client.exe (2832)	| ntdll!ZwQueryPerformanceCounter+0x12
[Context before #6791715, Context before #6791317]: chat_client.exe (2832)	| ntdll!ZwQueryPerformanceCounter+0x12
[Context before #6789863, Context before #6789677]: chat_client.exe (2832)	| ntdll!NtRemoveIoCompletionEx+0x12
[Context before #6789476, Context before #6788771]: chat_client.exe (2832)	| ntdll!ZwQueryPerformanceCounter+0x12
[Context before #6787397, Context before #6787227]: chat_server.exe (648)	| ntdll!NtRemoveIoCompletionEx+0x12
[Context before #6787026, Context before #6786408]: chat_server.exe (648)	| ntdll!ZwQueryPerformanceCounter+0x12
...
Work with a call’s arguments and return value with the Prototypes API
Using the built-in OS-Specific Information (OSSI) support, REVEN lets you see what functions are called anywhere in the scenario. The next thing we may want to know is with which arguments the functions were called, and what value they returned. REVEN 2.10 provides the new reven2.preview.prototypes API package that allows us to do exactly that.
For instance, we recorded the start of htop on CentOS 8:
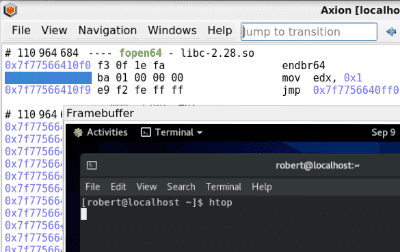
We can get the current function name at the selected instruction in Axion using the Python API:
>>> print(trace.context_before(110964685).ossi.location().symbol.name)
fopen64
Now, how do we get the arguments and return value of this call to fopen64?
First, a bit of preparation to use the Prototypes API:
# From the current instruction, step out backward to reach the call to fopen64
>>> call_tr = trace.transition(110964685).step_out(is_forward=False)
>>> print(call_tr)
#110964681 call 0x562f3fae25f0
>>> import reven2.preview.prototypes  # Import the Prototypes API
>>> prototypes = reven2.preview.prototypes.RevenPrototypes(server)
# Since we are recording a 64-bit Linux, the calling convention will be SysV64
>>> call_conv = prototypes.calling_conventions.Sysv64
# Pass the signature of fopen to the Prototypes API
>>> f = prototypes.parse_one_function("struct FILE; FILE* fopen64(const char *filename, const char *mode);",
...                                   call_conv)
From there, you can get the arguments and return value:
>>> call = f.call_site_values(call_tr)
>>> call.args()
{'filename': '/proc/spl/kstat/zfs/arcstats', 'mode': 'r'}
>>> call.ret()
0
(By the way, it looks like this particular call to fopen64 failed in the scenario)
Several calling conventions are supported (Linux 64, Windows 32 and 64) and the API makes it really easier to work with arguments, especially for functions that accept many, like the 11 arguments of NtCreateFile!
Generic prototypes
To quickly get an idea of the return value and parameters of any function in the trace, you can just declare a generic prototype such as void* f(void* p1, void* p2, void* p3, void* p4, ..., void* pn);. This should do the trick most of the time and can easily be adapted to add some more precise types.
For more information about the prototypes API, please refer to its package documentation.
Faster analysis (x2 to x17 in end-user scripts)
REVEN now provides the new “Executed Blocks” resource, which when replayed allows to retrieve transitions much faster than before.
This means that sequentially recovering transitions with the API, for example, will be faster:
%%time
for t in server.trace.transitions(0, 100_000):
    str(t.instruction) if t.instruction is not None else ""
| 100_000 sequential instruction recovery | time |
|---|---|
| REVEN 2.9 | 59.4s |
| REVEN 2.10 | 9.83s |
That’s a x6 speedup for the sequential case, but the impact is even bigger when retrieving random transitions rather than sequential ones:
# Generated once for all tests
import random
ts = [random.randint(0, 1_000_000_000) for i in range(0, 1000)]
# generating 100_000, but only 1000 used because otherwise would be too slow!

%%time
for tid in ts:
    t = server.trace.transition(tid)
    str(t.instruction) if t.instruction is not None else ""
| 1000 random instruction fetch | time |
|---|---|
| REVEN 2.9 | 45.8s |
| REVEN 2.10 | 412ms |
More than 100 times faster!
The gains are huge, because iterating over transitions is such a common operation in REVEN.
To demonstrate the gain for end-user scripts, we re-ran the detect-use-after-free.ipynb notebook from the corresponding article, on the same hardware, but with the new REVEN 2.10 instead of REVEN 2.7 which was used last time around.
| Scenario | Finding UAF with REVEN 2.7 | Finding UAF with REVEN 2.10 | Speedup |
|---|---|---|---|
| CVE-2019-0708 “BlueKeep” Check 0x7fb65010 for UAF | 8.65s | 502ms | x17 |
| CVE-2019-0708 “BlueKeep” UAFs in termdd.sys binary | 5min 47s | 1min 37s | x3 |
| CVE-2019-0708 “BlueKeep” UAFs whole trace | 1d, 19h | 5h 22 min | x8 |
| CVE-2018-11529 “VLC” Check 0x5a36cd20 | 1.8s | 241ms | x7 |
| CVE-2018-11529 “VLC” UAFs in VLC process, libmkv_plugin.dll only | 3h 5m 51s | 1h 25min 29s | x2 |
| CVE-2018-11529 “VLC” UAFs in VLC process | 18h 18min 1s | 1h 54min 51s | x10 |
| CVE-2018-11529 “VLC” UAFs whole trace | 1d 14h | 5h 21min | x7 |
While the speedup varies depending on the scenario, it remains significant in practice, with literal days saved in some workloads.
More OSSI
Improved OS support
REVEN 2.10 adds support for resolving OSSI for the CentOS 8 Linux distribution, and better supports the latest released version of Windows 10 (21H1).
In a few weeks, we will provide a CentOS 8 VM that is REVEN-ready for download.
More complete and customizable symbol demangling
Symbol demangling is the operation by which one can go from the symbol that is stored in the object file, such as _ZN76_$LT$core..str..Split$LT$$u27$a$C$$u20$P$GT$$u20$as$u20$core..fmt..Debug$GT$3fmt17h39b5c44e1b91ac81E, to the human-readable form of <core::str::Split<'a, P> as core::fmt::Debug>::fmt (well, more readable, at least 😅).
As such, symbol demangling is a key component to understand backtraces or the call tree widget.
While REVEN has been supporting the demangling of symbols for a long time, REVEN 2.10 brings several improvements to demangling:
- Better demangling support for MSVC symbols.
- Demangling support for Rust symbols.
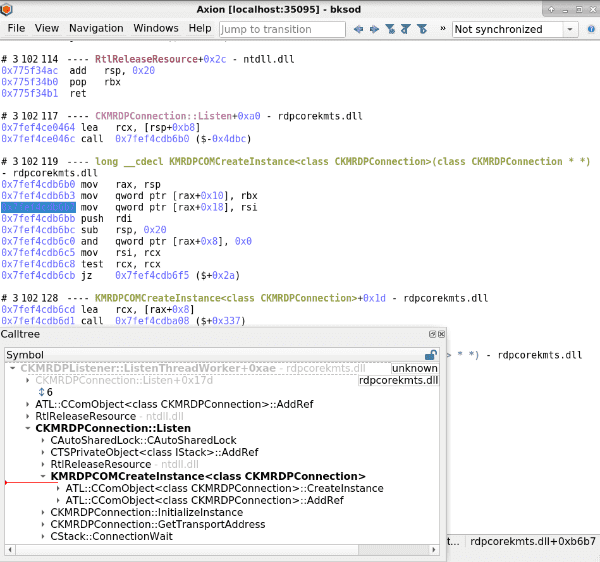
- Axion now supports displaying a shorter form of the demangled symbol. In the screenshot above, the
KMRDPCOMCreateInstance<class CKMRDPConnection>symbol is displayed without its full prototype in the call tree widget, while its full prototypelong __cdecl KMRDPCOMCreateInstance<class CKMRDPConnection>(class CKMRDPConnection * *)is available in the trace view at the point this function is called. - The Python API provides new properties on the
Symbolobject that allow to get the various demangled and mangled symbol forms:
>>> symbol = next(server.ossi.symbols("::AdviseSettingsChanged"))
>>> symbol.name_only
'CViewSettings::AdviseSettingsChanged'
>>> symbol.source_name
'?AdviseSettingsChanged@CViewSettings@@UEAAJPEAUIViewSettingsEventSink@@PEAK@Z'
>>> symbol.prototype
'public: virtual long __cdecl CViewSettings::AdviseSettingsChanged(struct IViewSettingsEventSink *,unsigned long *)'
This allows scripts to pick the form most appropriate to their use.
And More
- The new
automatic-post-fuzzer-recorder.pyfrom a recent article to connect REVEN in your fuzzing pipeline is in the package! - Click an address in a Jupyter Notebook to open an hexdump at that address in Axion:
The full list of improvements and fixes is available in the release notes.
Want to try REVEN? An extensive set of learning scenarios is available online, so just visit our Try REVEN page! Tutorials are available in most demos.
Interested in REVEN? Compare the features of REVEN Professional and REVEN Enterprise.
Discover Timeless Analysis Live.
