

Following memory history with REVEN-Axion
When working on traces of millions of instructions, one of the biggest challenges can be to detect the small portions of the code that are actually interesting. In this article, we have an application that reads from the network. We will show how to quickly find where the network frames are used, and if it is possible to cause a buffer overflow by writing more data than is allocated. As an example, we’ll be analyzing the following command:
wget -O /dev/shm/result.html http://192.168.56.1/index.html
We’ve set the output to shared memory so that the scenario can be smaller and have less unrelated kernel events.
Search: hardware devices
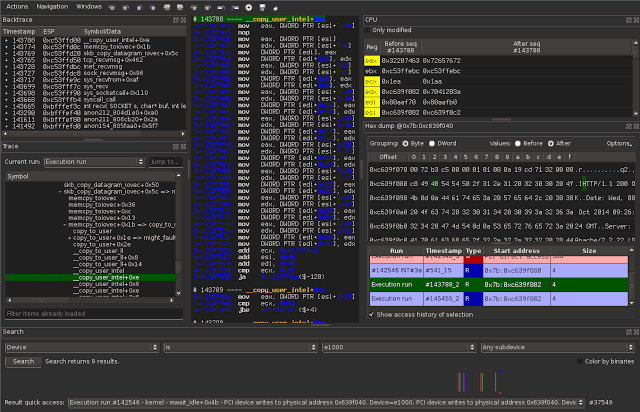
Since our point of interest is the network traces, we start by searching the device accesses of the network card. We’re looking for PCI writes here, since the network card writes to the physical RAM. One interesting PCI write we can find is the one that find its way into the hard drive: the response of the web server. This following image shows the overview of the device accesses during the executed scenario.

Here, we’re interested in the last PCI write, so let’s select it in the combo box. We can see that at sequence 142546, there is a PCI write to physical address 0x639f040. In 32 bits Linux, this is mapped in kernel space at the linear address 0xc639f040.
Memory dump
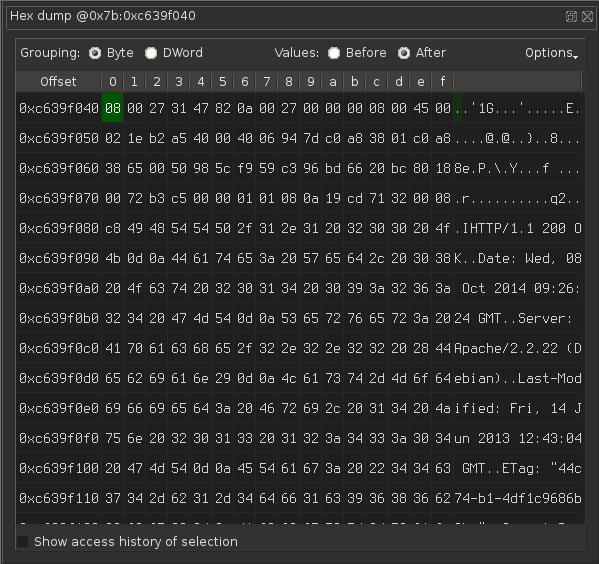
Let’s request to see the contents of the memory right after the PCI write. Here, we find what looks like a normal Ethernet dump of an HTTP request.
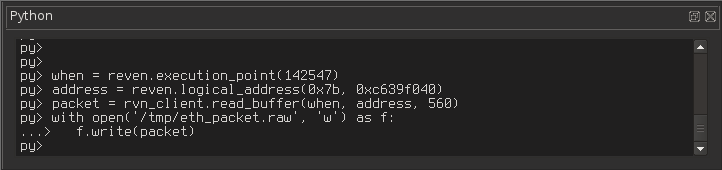
Let’s dump into a file using the integrated Python console:
Let’s open it in Wireshark after converting it to a proper format using the hd command:
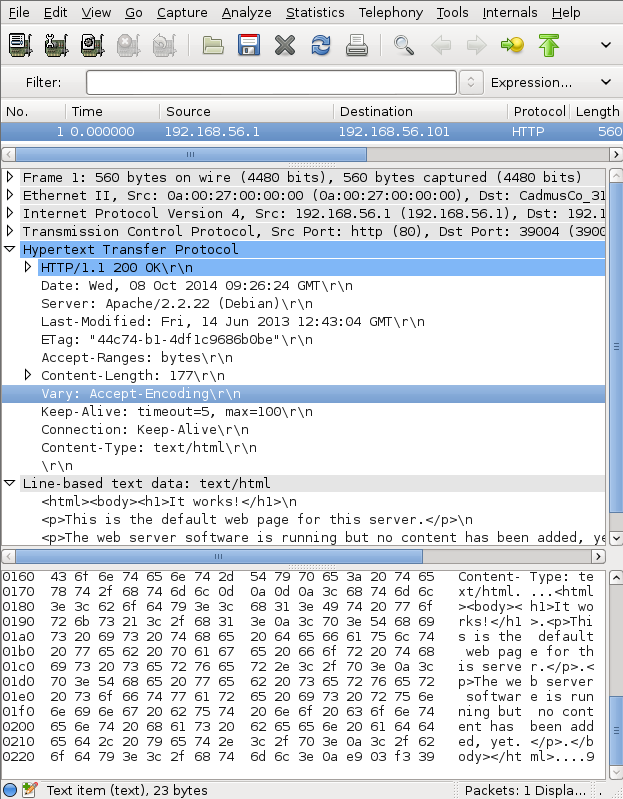
This confirms that we’ve found a complete Ethernet frame, and that we can browse it using other tools. With some scripting, we could even rebuild the entire communication between the two hosts, as if we had listened to the interfaces the whole time.
Memory history
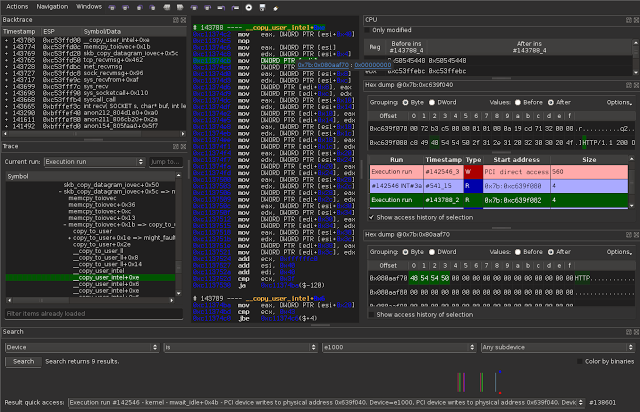
Now, let’s look for a potential buffer overflow. We have a PCI buffer that is written, we need to find where it is read from. To display where and when an address is used, just check “Show access history”:
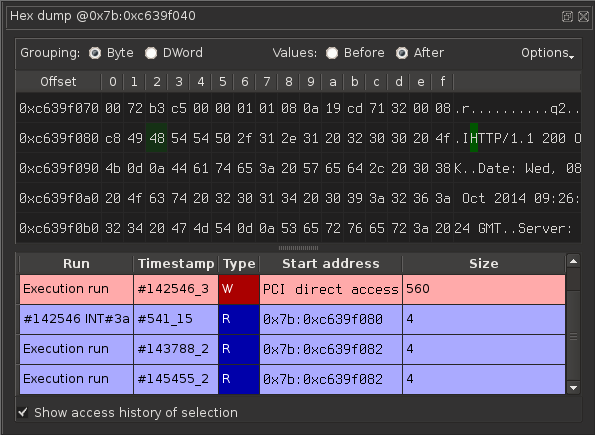
I’ve selected the H of HTTP so that we may find the user code parsing the HTTP header. We can also see the kernel code parsing the Ethernet headers if we monitor other parts of this frame.
The first write corresponds to the PCI write. That’s why there is no logical address for the write: it was not done using logical addressing, but it was caused by a PCI access directly into the RAM. We can see that the PCI bus writes 560 bytes in one batch (which is why I’ve exported a file with 560 bytes earlier).
There are three other reads here. The first one leads to a read inside an IRQ (this is IRQ 10, which is mapped at vector #3a) If we double-click the first one, we get this stack trace:
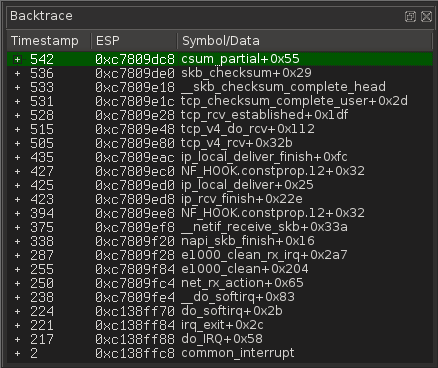
Actually, in this case, the IRQ handler is just comparing the checksum of the received data with the checksum received in the TCP header. It is not particularly interesting here, unless we’re looking for kernel bugs. Let’s take a look at the next read from this kernel buffer:
In the backtrace widget, we can see that userspace called the recv syscall. By clicking the parent sequence at 143290, we could find the parent trace. But before doing this, we should locate where the buffer is written.
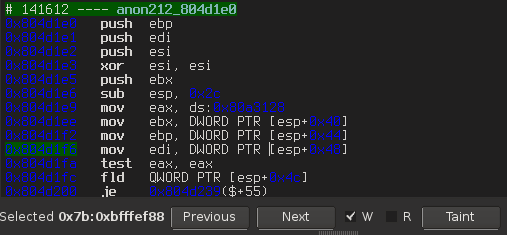
By looking at the assembly code for the function
__copy_user_intel, it is quite clear that the source is in ESI and
the destination in EDI, the counter in ECX in bytes, just like a REP
MOVSB.
Since we want to know where the memory is written to, let’s follow the memory pointed by EDI, at 0x80aaf72 in our example.
Previous / next
By double-clicking DWORD PTR [EDI] on the 5th instruction, we can quickly see the content of this memory and access its history if wanted, just like before.
There is a even quicker way, though. By selecting the memory using F7 (first operand), we can navigate to its next read or next write. For example, let’s say that we want to check for a possible overflow in the recv function. We’ll have three things to check :
- where does the length given to recv comes from,
- where is the destination buffer allocated, and what is its size,
- if both sizes are unrelated, is it possible to have an overflow and on which conditions.
To find out where the length of recv comes from, the easiest way is to go through the backtrace to the recv call and to use the argument displaying feature of the backtrace:
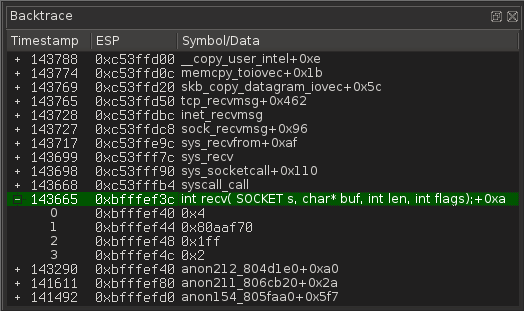
We can see that the parameters are:
- socket: 0x4
- buf: 0x80aaf70
- len: 0x1ff
- flags: 2 (MSG_PEEK)
Note: since the flags are MSG_PEEK, we can expect another read to
return the same data later (remember at the previous step, there was one
more read from the PCI buffer).
Once we know that the size if 0x1ff, the next objective is to know how it is calculated. The value was given by EDI, so let’s see where it came from.
We just have to press F8 (second operand) to select EDI. Then a click on previous (shortcut: Shift-N) leads me do its previous write. In this case, previous write is a pop. We can either use the “percent” plugin (see the associated blog post), or just go to the function start (assuming that nobody modifies the stack). Either way, we find the corresponding push, which is a push edi.
Clicking once more on the previous write to EDI leads us to this memory read, that we can browse again with F8:
We can request the previous write of the stack memory, and so on. After going up several times (using only F7/F8 and Shift-n), we finally reach the origin of the size:
So the received size is static. It is always 200, and the only calculation done here is a -1, probably to be sure to keep a null terminating byte.
The exact same steps can be taken with the buffer value, backtracking the pointer origin.
We find that the pointer is allocated inside the same function that called recv, with the same size (obviously without the -1, this time). In this case, we can see clearly that an overflow is not possible, even if we could control the server side.
Second read
- Earlier, we noticed that the buffer was read one more time. Let’s focus on this other read now.
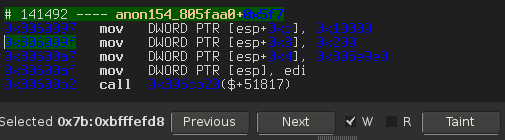
We know this read occurs at 145455. This is another copy_from_user
call. The interesting part is that the backtrace now shows a read call:
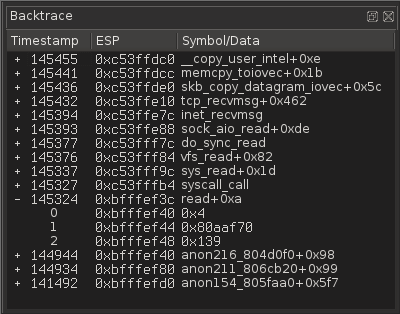
The arguments of the read are:
- fd: 4
- buffer: 0x80aaf70
- length: 0x139
It is interesting that the length is not the same as before (0x200).
We might be interested on how that particular size is computed. In
particular, is it possible to make this size bigger that 0x200 ?
After doing the same process again to the origin the length we can
find that it is computed by substracting a pointer (let’s call that
pointer buf_end) returned by a function with the buffer start address.
The interesting part of the buffer computation function is before the
return value:
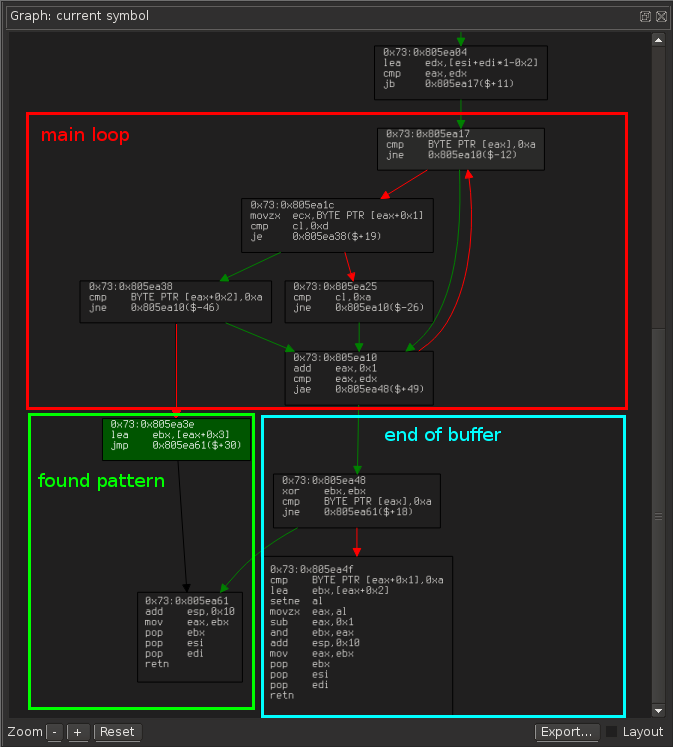
The loop (red section) searches for a 0xa (newline character). It increases as long as eax doesn’t go path edx.
Once we find the string 0xa 0xd 0xa (\n\r\n), we return the pointer right after the 3 newlines (green section). Since we ensure that eax < edx, we can at most read up to edx + 2.
In the “end of buffer” case (blue rectangle), if we’re not at a newline, we return NULL. In the other case, we return the pointer to the right after the last newline character (with some code in case there are two newline characters). We cannot get past edx + 2 either.
Here the interesting part is the central role of edx, which is probably near the end of buffer.Once again with the previous write feature, we can see that edx si computed as follows:
``` edx = buf_start + size - 2 ``
That explains why we could read up to edx + 2.
Here, size is 0x1ea. It is bigger than 0x139, but why isn’t it 0x1ff ? Let’s go backwards a bit more. I’m going to spare you the details because I used the same process as before: 0x1ea is actually the return code from the recv function.
This means that wget first uses recv with MSG_PEEK with 0x1ff as
buffer size. Once it has its result, it re-reads the same data, but with
only the length returned by recv (which is always less than the input
size). This means that in the second read too, there are probably no
obvious overflows to discover.
By the way, the function we analyzed here merely looks for two newlines to detect the end of the headers in an HTTP request.
Conclusion
Throughout this article, we analyzed a small part of the reception of wget.
We saw how to quickly find the way data coming from the network is used. We can easily find where this data is read or erased, where the reception buffer is allocated and so on.
This is a major tool within REVEN-Axion : the ability to view the memory history in both directions, up to the physical layer.
