

Data painting
In this post we’ll present Reven dynamic data tainting capabilities and see some use cases of the tool.
Dynamic data tainting
The so called data tainting is a well known technique used to analyse the impact of data on a program. The idea is to apply a taint to a given memory and spread or remove it on every read/write operation. I like to compare data tainting to contrast medium, which is a liquid used by medical institute to enhance the visibility of blood vessels. Once injected into the blood vessels, the contrast agent is spread in the whole body and help the doctors to make diagnostics. Data tainting is the same principle for programs.
In practice, reading data from a tainted memory or register will spread the taint to this data, and conversely, writing data into a tainted memory/register will remove the taint.
This can be applied statically or dynamically. While static analysis algorithms are based on a control flow graph, dynamic ones work on an execution trace (which can be seen as a control flow sub-graph with unrolled loops). Each has its pros and cons, but for the sake of brievity we’ll just note the better reliability but a lower code coverage of dynamic analysis against static ones.
The Reven way
The Reven data painter has a byte-level granularity and supports both forward (natural execution flow) and backward data tainting.
From an end-user point-of-view, the painter may be used interactively through the Axion GUI, allowing propagation and visualization of multiple taints in real-time, or using the python API.
 To show the Reven data tainter in action, we’ll use the
CVE-2014-8485 affecting libbfd and the proof of concept provided
by Michal
Zalewski here.
To show the Reven data tainter in action, we’ll use the
CVE-2014-8485 affecting libbfd and the proof of concept provided
by Michal
Zalewski here.
We will use this simple crash to show a common workflow with Axion and the Python API.
As said in the linked article, by launching the Gnu \ strings command on the proof of concept file, we get a program crash caused by an invalid memory read. The faulting basic block code reads eax from memory and then uses it as a memory pointer; but as the CPU view shows, the eax register has an invalid address value of 0x41414141 resulting in a page fault immediately followed by the death of the process.
We can backtrack the origin of the eax value like we already did in a
previous \ post <http://lifeat.tetrane.com/2014/11/following-memory-history-with-revenaxion.html>,
or, as
the \ auto-generated <http://lifeat.tetrane.com/2014/11/using-text-strings-in-reven.html> comment
points out, we can see that the value pointed by esi corresponds to a
string, which in this example directly comes from the ELF file.
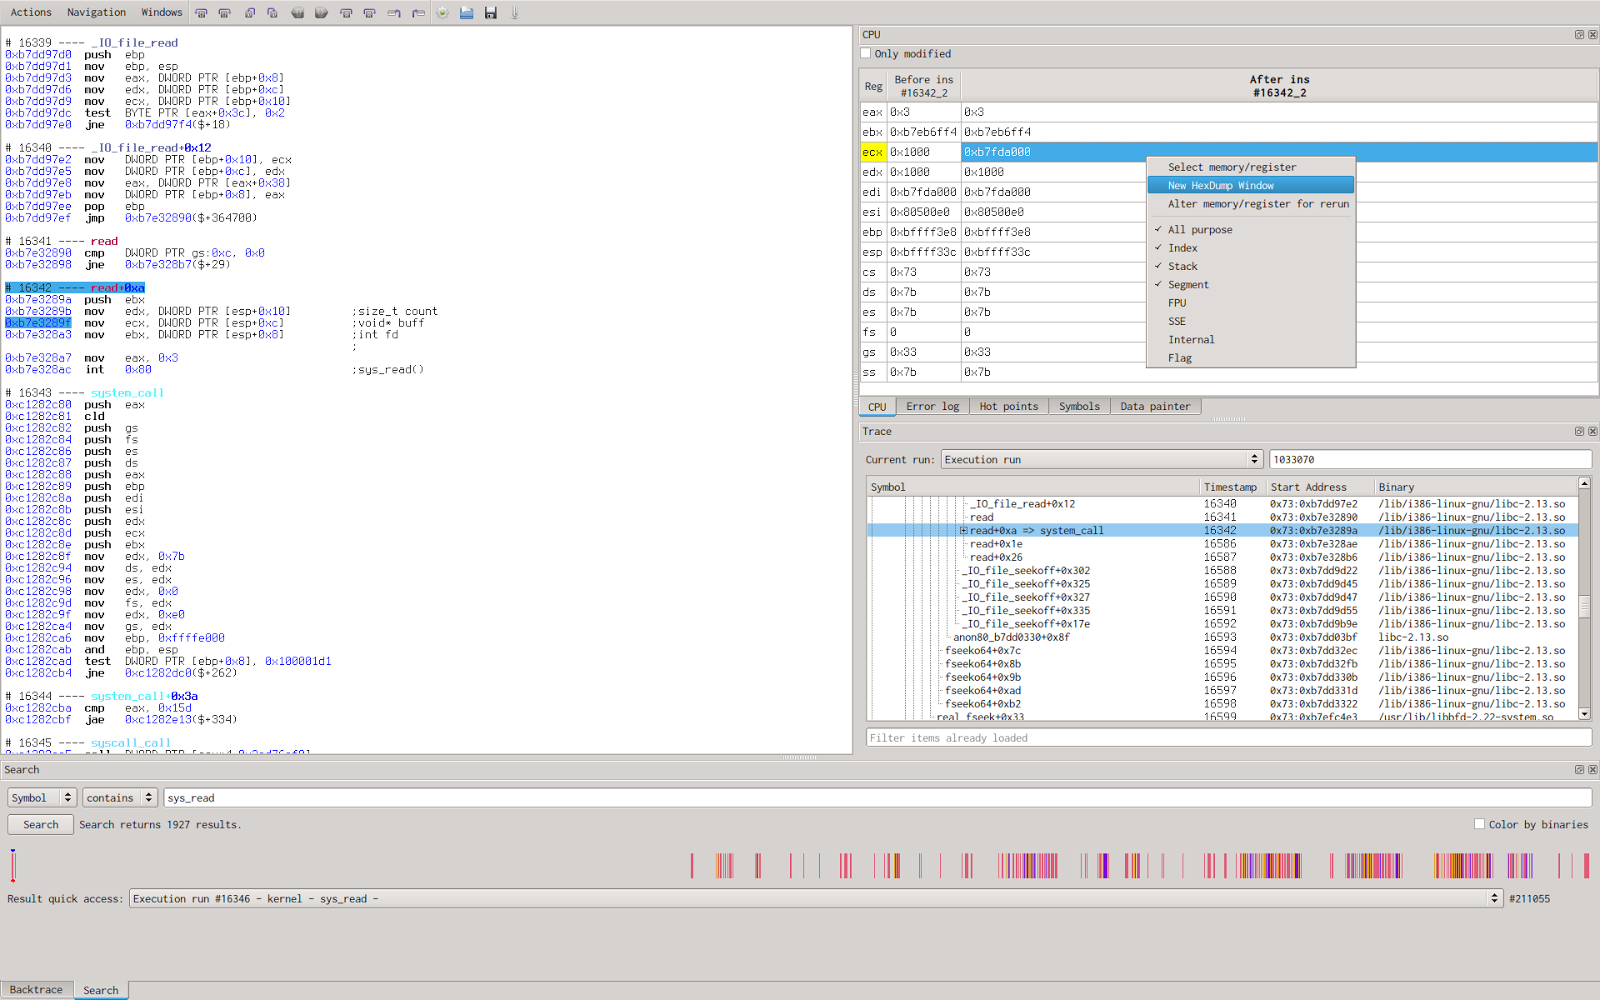
We now want to taint the double words previously found (which trigger the bug) to highlight its usage in the program. Because the value is read from the ELF file, we choose to search for read() system calls and then look at the buffer argument after the syscall, hoping to find our ELF file copy in memory. To obtain the value of buffer, I just select the right register before the syscall to get the buffer pointer value and then open a new hexadecimal view of the memory at this address.
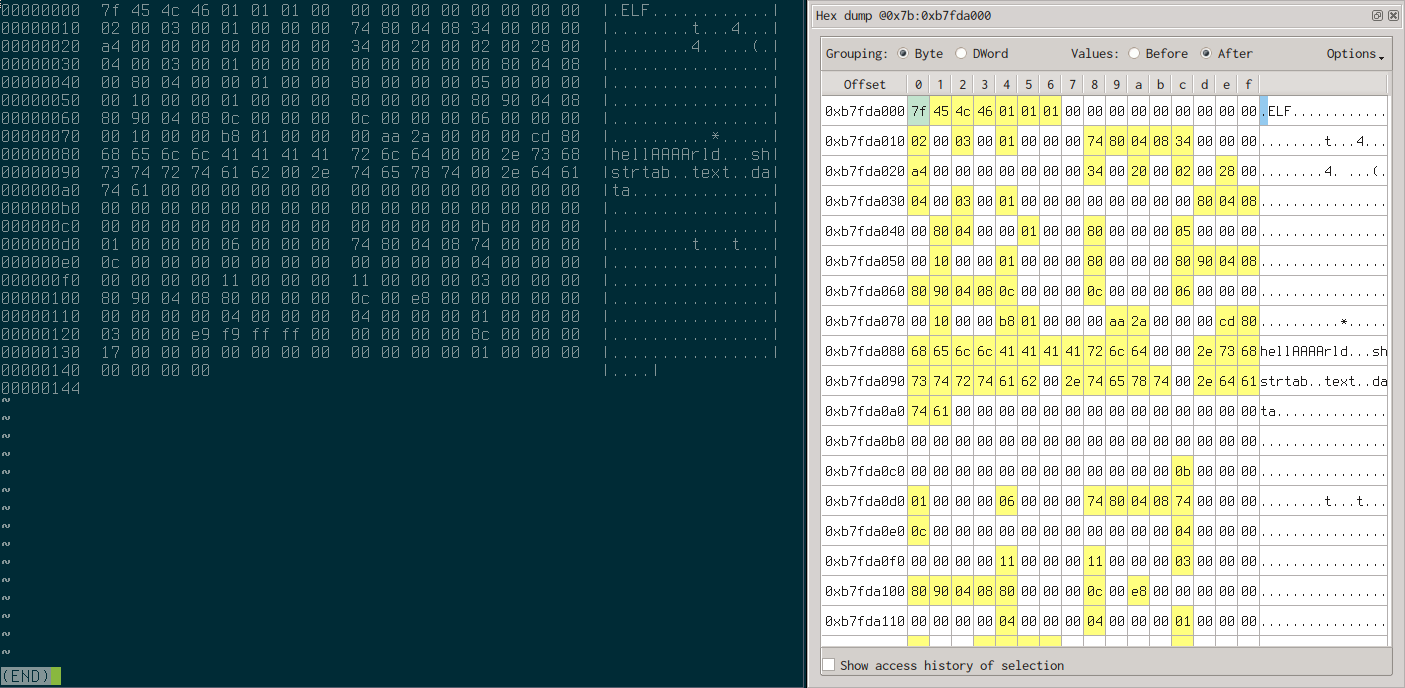
We ensure that the file is entirely read by inspecting memory and make a quick comparison with our original file hexdump.
Interactive tainting
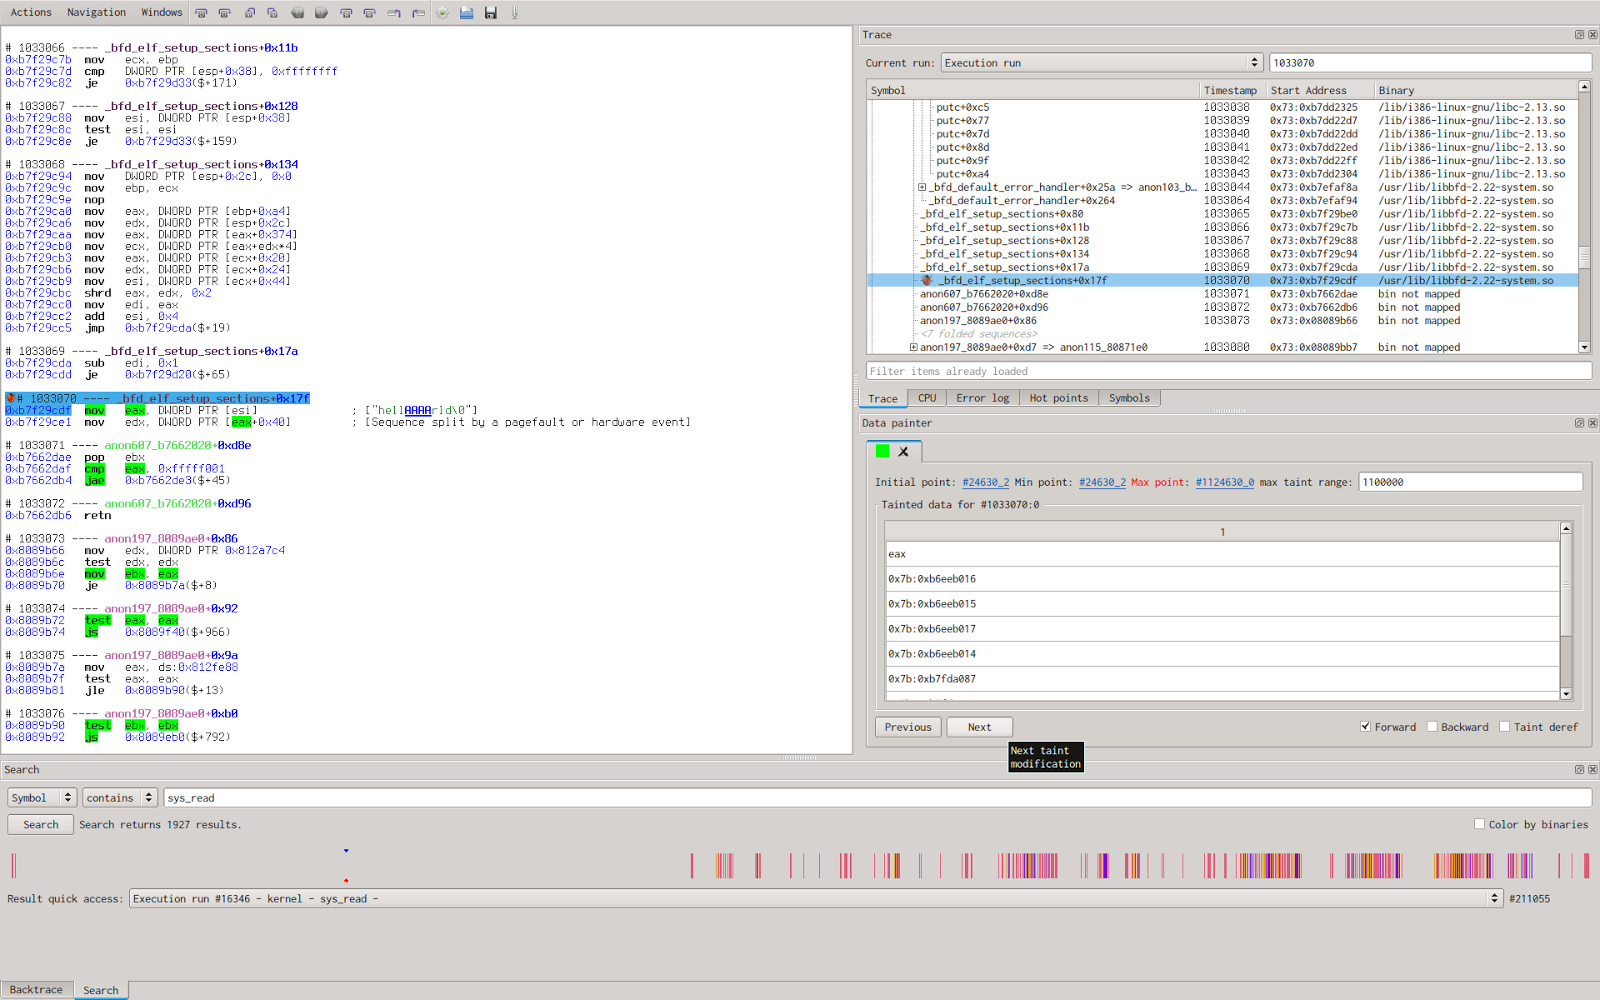
We’ll now apply a taint on the 0x41414141 double word in memory and tell Reven to propagate it on the whole trace.
By doing so, we’ll obtain a plain trace with some colored instructions meaning they have impact on the taint (either propagate or remove the taint in some way) and we can browse through the previous and next instruction changing the taint.
Trace slicing
We’ll now use the python API to perform a \ dynamic program
slicing <https://en.wikipedia.org/wiki/Program_slicing#Dynamic_slicing>__; the
goal here is to filter out instruction unrelated to interesting data
processing, this result in a filtered and thus more compact view of the
interesting code flow.
To obtain a trace without all the “garbage” instructions, we’ll use the Python bindings provided by Reven to exactly do what we just did with the Axion client, but this time by only displaying tainted instruction.
The first step is to connect to a running instance of reven with libbfd trace.
    import reven
    rvn = reven.reven_connexion("localhost", 13370)
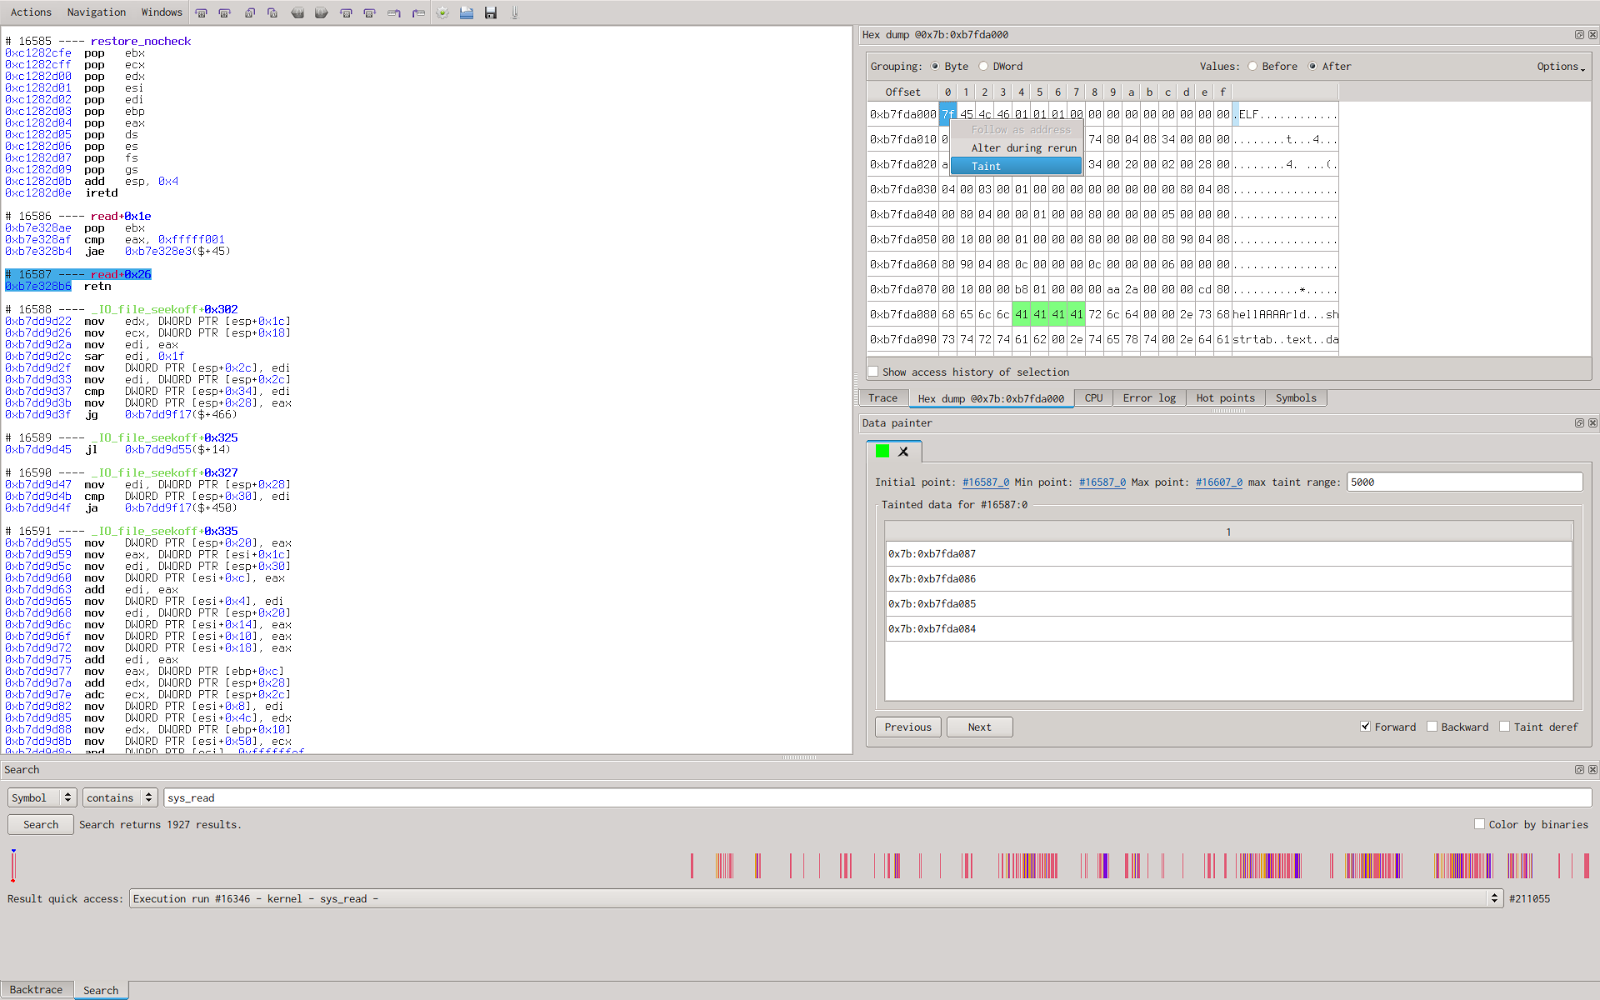
Then setup an initial execution point (where the taint starts) and associated tainted data, in our case, we choose the sequence #16587, just after the syscall end and we taint the four bytes previously located.
    run = "Execution run"
    startpoint = reven.execution_point(run, 16587, 0)
    # Memory containing the 0x41414141 dword
    address = reven.logical_address(0x7b, 0xb7fda084)
    memory = reven.logical_address_range(address, address+4)

    # Get the cpu context at the start point including our 4 bytes memory range
    startctx=rvn.run_get_running_context(startpoint, memory)

    # Extract memory objects from context
    inittaint = []
    for mem in startctx.memories:
        inittaint.append(mem)
We then tell the data painter to propagate the taint until the sequence #1033070 (The sequence where the crash happens).
taints = rvn.run_search_tainted_instructions(startpoint, endpoint, inittaint)
The data painter will return a python dictionary with execution point as key and taint diff as value. Taint diff are objects which reflect the changes of the taint, they are composed of a list of new tainted data and a list of removed tainted data. To obtain our sliced trace, we just need to request the instruction matching a given taint diff and display it.
    Tainting
      ('0x7b:0xb7fda084, ', '', None)
      ('0x7b:0xb7fda085, ', '', None)
      ('0x7b:0xb7fda086, ', '', None)
      ('0x7b:0xb7fda087, ', '', None)

    from #16587:0 to #1033071:0
    -----------------------------------------------

    __mempcpy+2d:#24631_0:
         rep  movs DWORD PTR es:[edi], DWORD PTR ds:[esi]

    _bfd_elf_setup_sections+17f:#1033070_0:
         mov eax, DWORD PTR [esi]
The resulting sliced trace is composed of two instructions instead of more than five millions. This allow us to quickly discover the data travel during the program execution; the data is directly read from the ELF file, then it’s copied into a buffer from which the wrong memory address will be read.
To go a step further, we may now want to list all instructions dealing with tainted data, especially branching instructions as they will reveal (obviously not strict enough) data constraints. But this will be presented in a next article introducing instruction semantic.
In this introduction to the Reven data painter, we only cover basic usage by using one taint at a time with forward propagation only, but the data tainting techniques allows more complex analysis from type recovery and obfuscation mitigation to bug research with smart fuzzing.
