

Timeless Full-System analysis with REVEN and WinDbg
REVEN 2.5 introduced a new integration between REVEN and Microsoft WinDbg.
This integration brings WinDbg and REVEN closer together, allowing you to access a REVEN trace as if it were a live VM and benefit from REVEN’s full-system timeless analysis and full-fledged scripting API, together with WinDbg’s familiar debugger interface.
In this article, we’ll demonstrate several cases where the bridge helps in the analysis.
But first, how to connect REVEN with WinDbg?
Using REVEN with WinDbg
Using our rvnkdbridge to connect REVEN with WinDbg is very easy! You can grab the program from the DOWNLOADS page of
the REVEN Project Manager, and then just execute it anywhere on a Windows machine that has WinDbg installed. No runtime
dependencies (other than WinDbg itself)!
To access your trace, you first need to connect the bridge to a running REVEN server using the familiar “host:port”
syntax. The bridge creates a named pipe, to which you can connect WinDbg.
REVEN’s documentation details this process.
Because WinDbg sees the REVEN trace as a VM being debugged, you will need to select one point (transition) of the trace to represent the current state of that VM.
Once you’re connected at the chosen transition, you can try basic WinDbg commands, after an initial .reload command.
For instance, you can try k to display a backtrace:
If you need to move to another point of the trace, you can use the go command of WinDbg. When doing so, rvnkdbridge
will ask you to which transition you want to go.
This covers the basic usage and browsing of a trace using WinDbg, but REVEN already provides a backtrace feature. What else can we do with WinDbg?
Describe exceptions
WinDbg can be used to get more information about an exception. For instance some time ago we analyzed a Quick Player
exploit (we have not had time to write about it just yet!), and so here we are at the point of the trace where an
exception handler that is part of the exploit is executed:
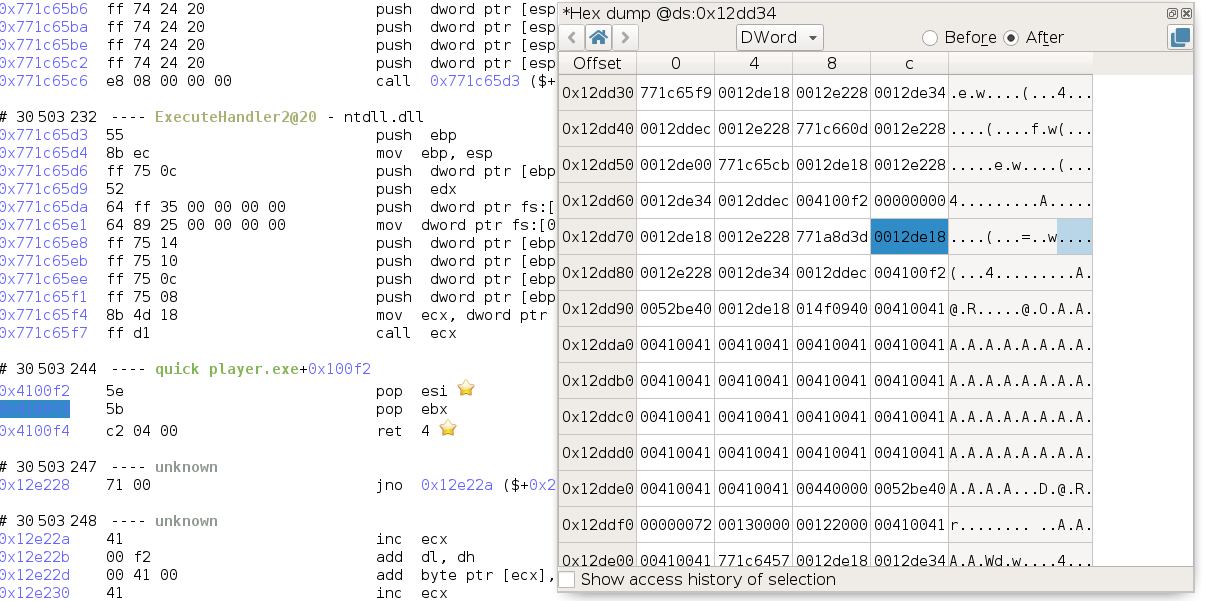
Looking at the stack, we can find the address of the EXCEPTION_RECORD structure as the first argument to
Quick_Player_exe+0x100f2, and the address of the EXCEPTION_CONTEXT structure as the third argument to this
function, so respectively 0x12de18 and 0x12de34.
Using the .exr and .ecr commands on the EXCEPTION_RECORD and EXCEPTION_CONTEXT yields:
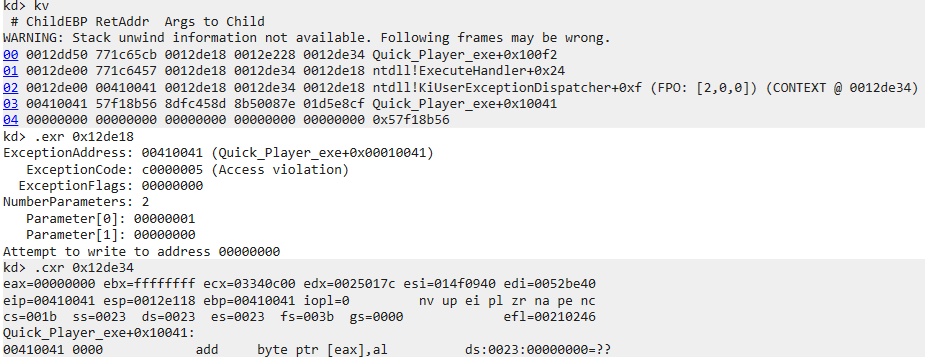
While this information can of course also be derived by analyzing the trace in REVEN (actually this is what the integration is doing), WinDbg presents in a way that is familiar to users of the debugger. We can see that the exception is caused by an access violation while trying to write to a null pointer.
Tell me what this handle is
In a previous video, we showed how we could use the WinDbg
integration to find what file a handle was referring to.
At the time, we were using a preview version of the integration, but you can now reproduce these results in REVEN 2.5.
The interesting part of this example is that we first use REVEN features such a symbol search to get a starting point in the trace and the backward data flow analysis (taint) to find back the cause of the crash, and then we corroborate our findings with WinDbg.
Playing with threads
Using WinDbg, you can get information on the process that is executing at the currently selected point in the trace,
using the !process command. In particular, this command displays a list of the threads of the process.
For example, in the tokio_chat scenario, we have chat_client.exe that sends to and receives messages from a
chat_server.exe.
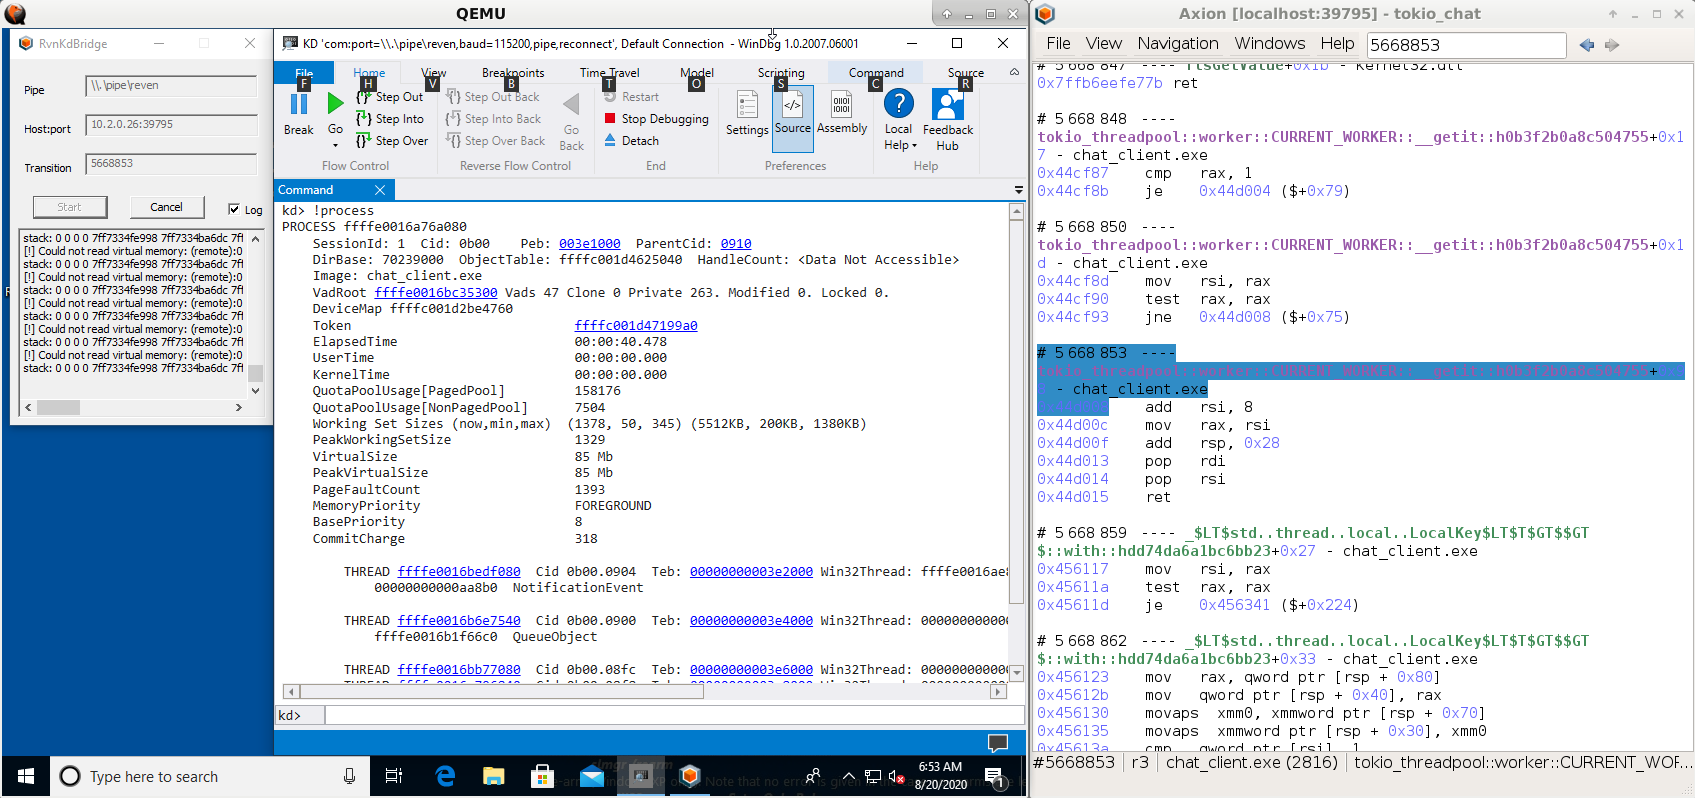
The !process command lets us see that chat_client.exe has 4 threads at this instant in time. More importantly, we
can see the backtrace of each thread individually.
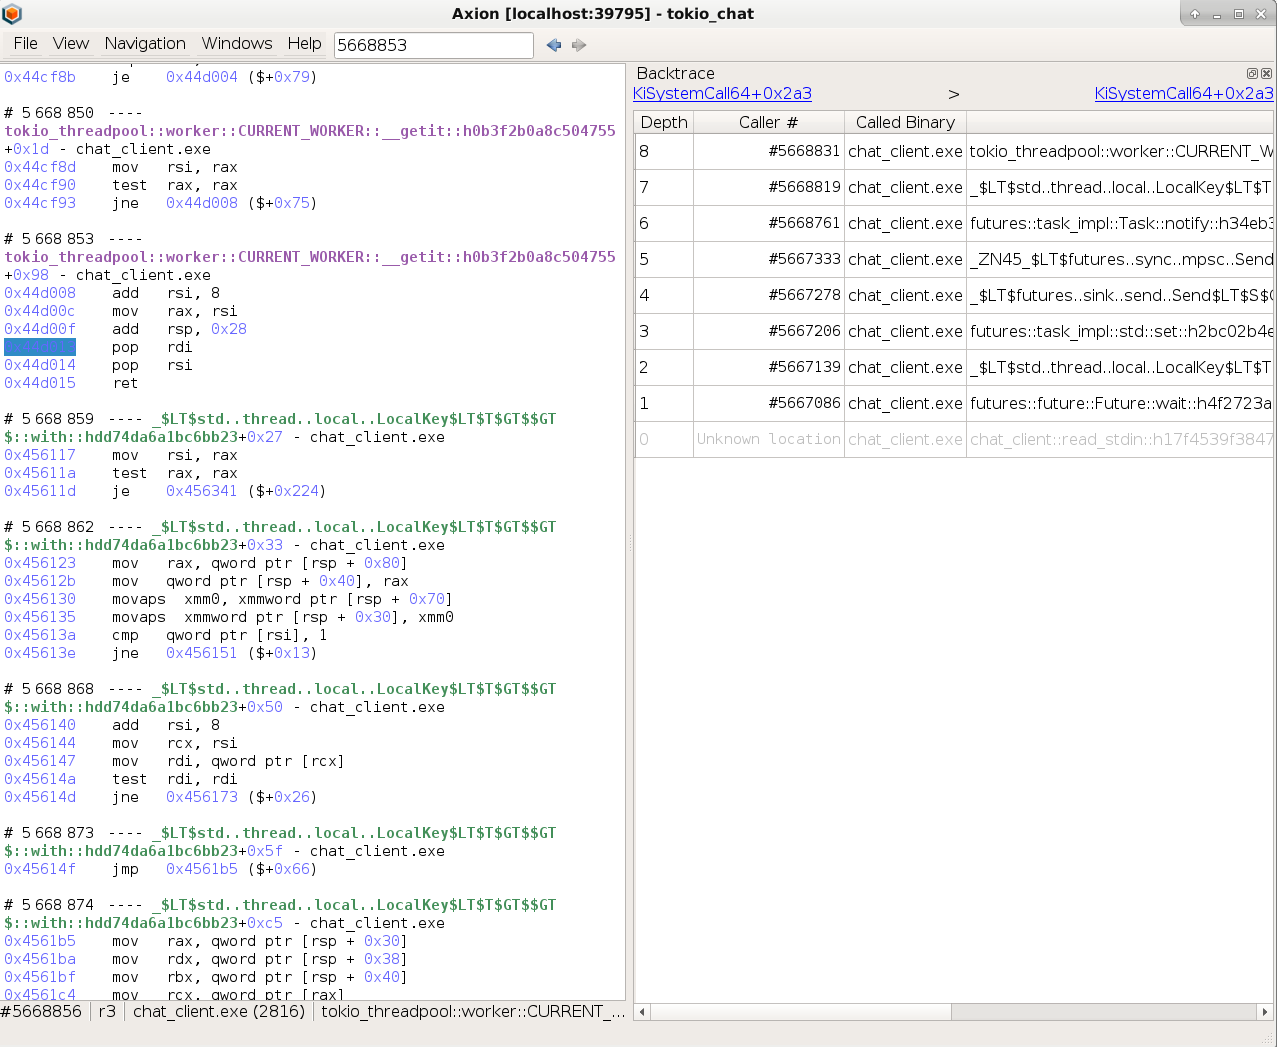
Uh oh, it looks like our backtraces don’t have the symbols for chat_client.exe, yet REVEN have them:
I freely admit that I’ve been scratching my head for a while on that one. Is it because we’re in a REVEN trace and not an actual VM? How is WinDbg accessing the binaries from within the debugged VM, by the way? Maybe I should recompile the binary in debug mode? Try to produce a PDB?
It turned out that I had compiled this test sample using the GNU rust toolchain that is based on the mingw linker, and apparently WinDbg is not very good at displaying symbols from mingw binaries, although extensions for this seem to exist.
Well, REVEN has them anyway, so with just a bit of scripting we should be able to augment our backtraces with the Lost Symbols.
So let’s do some Python:
import reven2
server = reven2.RevenServer('10.2.0.26', 39795)  # connect to server
ctx = server.trace.context_before(5668853)  # spawn the context to which WinDbg is connected
ossi = ctx.ossi  # get the OSSI for that context

base_address = ossi.location().base_address
rva = 0x9b52f  # rva reported by WinDbg in the stack trace

ossi.location(base_address + rva)  # get the OSSI location at this address
Executing this code yields the following result:
Location(binary='chat_client', symbol='miow::iocp::CompletionPort::get_many::h98476aa33397cbee', address=0x49b52f, base_address=0x400000, rva=0x9b52f)
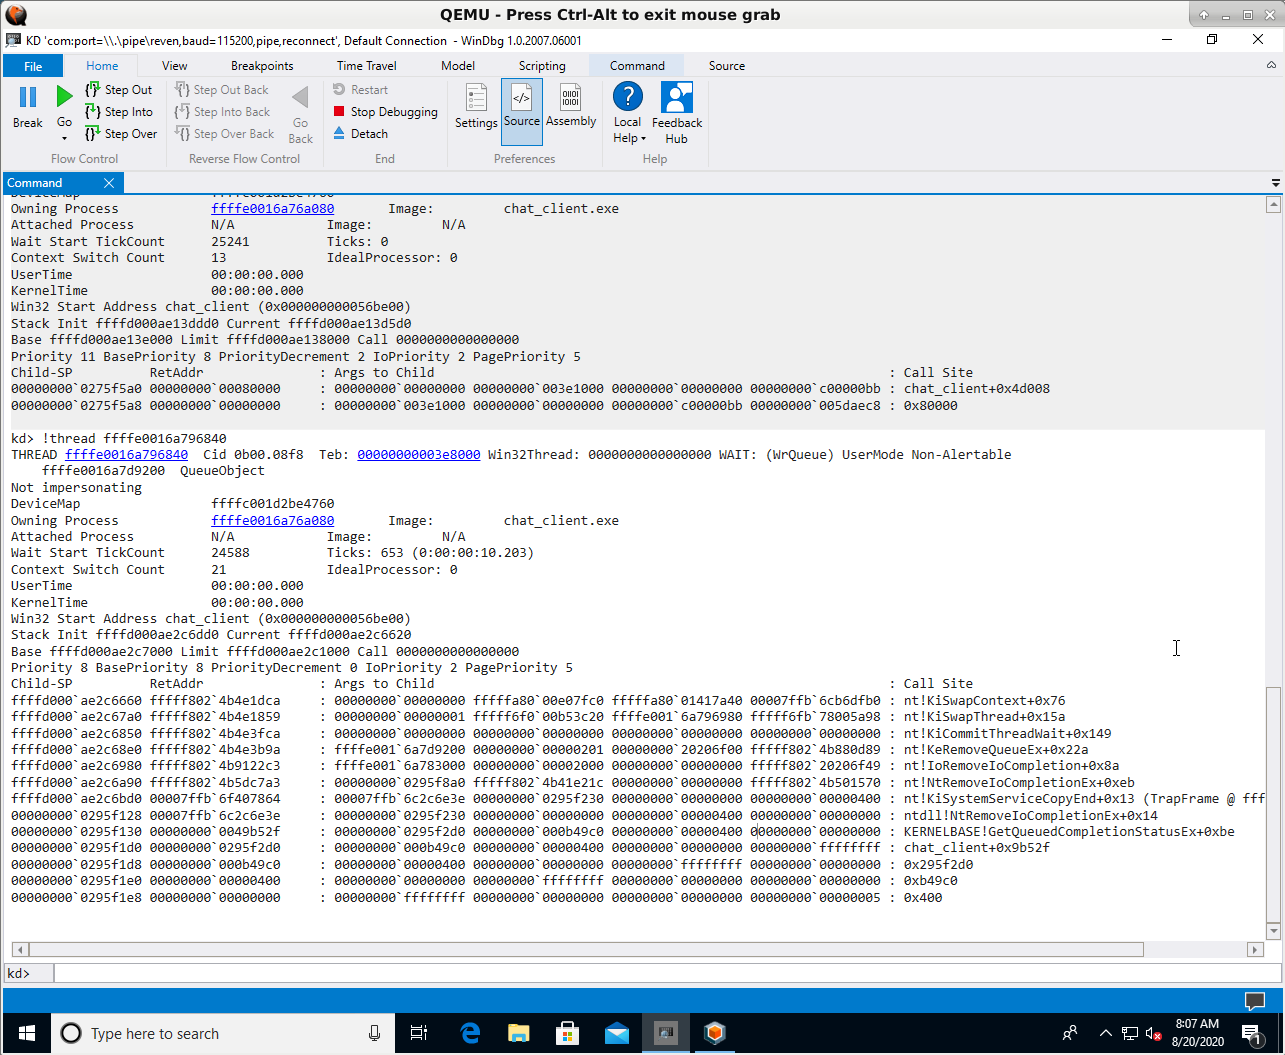
This gives us the missing symbol in the stack trace reported by WinDbg:
miow::iocp::CompletionPort::get_many::h98476aa33397cbee. So, from reading
the doc,
we can see that this thread is waiting for the completion of some I/O events.
A small aside, but if you’re very familiar with tokio and Rust’s internals, you may have noticed that the tokio_chat
trace (that you can test in our online demo of REVEN, by the way) uses a
fairly old version of both tokio and Rust.
The reason for this is not that we chose to record and old version on purpose, but rather that this record was made
when these versions were still fresh, then archived and later replayed again today!
We can check that, as WinDbg allows us to tell the current time in the debugged VM:
At transition 0:
kd> .time
Debug session time: Tue Oct 15 14:58:20.463 2019 (UTC - 7:00)
System Uptime: 0 days 0:06:31.995
At the last transition:
kd> .time
Debug session time: Tue Oct 15 14:58:24.620 2019 (UTC - 7:00)
System Uptime: 0 days 0:06:36.151
That’s right, about 4 seconds elapsed between the beginning and the end of the trace, and this trace was recorded in October 2019, long before we had WinDbg integration in REVEN.
Having the ability to analyze again later the same trace using new tools is a very valuable proposition of timeless debugging and a reason why we strive to provide maximal backward compatibility for your records in each new release of REVEN.
Going further with dbgkit
WinDbg can be extended with plugins, and these plugins can also benefit your analyses with REVEN. For example, we can
use dbgkit to get a view similar to the live process explorer window!
This allows you to see at a glance all the processes that were running in the recorded VM, at any given point in the trace, as well as various useful information about the state of the VM.
And more
This article demonstrated some of our recent uses of WinDbg with REVEN, and as you can see, there are many
possibilities! Combining REVEN’s advanced dynamic analysis algorithms such as backward
dataflow analysis (taint) with WinDbg’s understanding of the finer points of the Windows OS, such as threads and
file handles, creates a synergy that improves the speed of your analysis.
In REVEN 2.6 (coming in September 2020), we are adding more features such as stepping and breakpoint support. This will enable WinDbg users to get even more out of REVEN.
If you’ve got other ideas of how to combine REVEN and WinDbg, feel free to hit us on Twitter!
