

Who's calling? Finding out which process made a system call
by Louis
Categories: Tutorial - Technical -
Tags: Automation - Syscall - Reverse Engineering - Script -
The version 2.2 of REVEN saw the addition of the Analysis Python API, that lets you automate the analysis of a scenario using scripts.
The API sparkled the interest of our users and gave them inspiration to handle many use cases by scripting. One of these use cases is going back from a given system call in the trace to the user-space process, or at least the name of the binary, that was responsible for the call.
Today’s article focuses on this use case of finding back the process that made a specific system call, and how this can be solved heuristically by a REVEN script.
For this article, we are using our bksod execution trace, that was recorded on the bluekeep vulnerability (CVE
2019-0708).
However, the specifics of this scenario do not really matter for this article, it is just used as material
for demonstrating the script.
For your convenience, the full script that we will build in this article is downloadable from here.
System calls and why backtrace won’t help you
Performing a system call is the way a user-space program requests a service from the operating system. A system call is
used for tasks such as performing IO (opening, creating, reading and writing files), spawning threads or subprocesses…
Since REVEN is a full system analyzer, the execution traces it produces contains all the system calls made by all
programs that occurred during the recording of a scenario. So, taking NtCreateFile as an example system call, we can
perform a search of all calls to that symbol using the API:
>>> ntcreatefile = next(server.ossi.symbols('^NtCreateFile$', binary_hint=r'ntoskrnl\.exe'))
A lot is going on in this simple line, so more explanation is in order:
server.ossiis the OS Specific Information associated with the trace. It lets find the binary and symbols present in the trace.server.ossi.symbolsin particular lets you search symbols present in the trace by patterns. It is important to understand that this search returns the existing symbols in binaries that appear in the trace, regardless of if and how many times these symbols are actually called in the trace.'^NtCreateFile$'is the pattern to search. Because the pattern is a regular expression, we enclose it with^and$to indicate that we are specifically searching forNtCreateFileand notVerifierNtCreateFilethat would also match had we simply putNtCreateFileas the regex pattern.binary_hintindicates in which binaries we should look for the symbol. It is also a regex pattern. It is important to give abinary_hintwhen searching for symbols for a performance reason: without any hint, all binaries are searched for matching symbols, which takes an unreasonable amount of time for a typical trace.- Because the call to
server.ossi.symbolsreturns a Python generator, we need to callnexton it to get the first result (hopefully theNtCreateFilesymbol inntoskrnl.exe) and discard the other results. Should we need to iterate on the returned symbols instead, we would use a for loop:>>> for symbol in server.ossi.symbols('^NtCreateFile$', binary_hint=r'ntoskrnl\.exe'): >>> # do something with symbol
We can check the returned result simply by printing ntcreatefile:
>>> print(ntcreatefile)
ntoskrnl!NtCreateFile
Looks OK!
Now that we have a handle to the NtCreateFile symbol of ntoskrnl.exe, we can actually look for calls to this symbol
in the trace, with the following loop:
>>> for ctx in server.trace.search.symbol(ntcreatefile):
...     print(ctx)
...
In less than 10 seconds, this will print every context immediately preceding a call instruction to NtCreateFile in the
entire trace, yielding the following results:
Context before #4468509
Context before #4479526
Context before #6451786
Context before #6852400
Context before #7666717
...
Context before #1217570337
In this output, note that #n refers to the nth instruction executed in the trace. For each of these
instructions, REVEN provides access to the machine context (CPU, memory, …) before executing the instruction, as
well as the context after executing the instruction. You can correlate an instruction number with its contexts using
the trace view of the REVEN GUI.
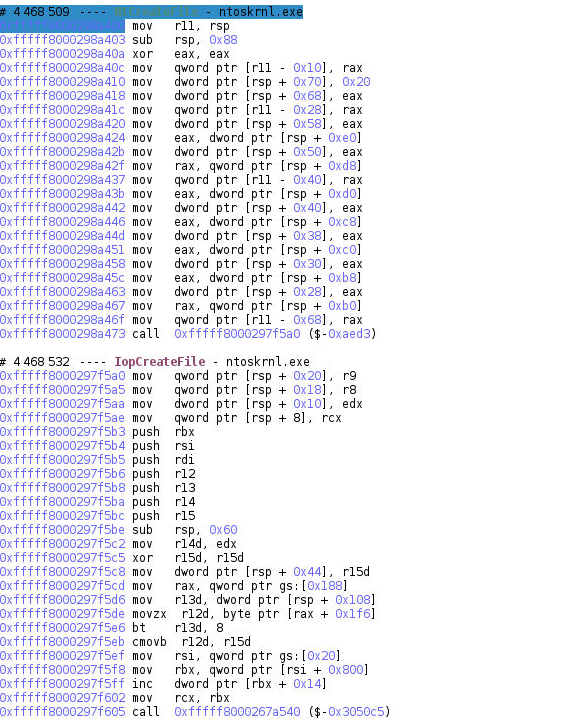
Now we can go to the first context in Axion and have a look at a system call in the flesh:
Now, from there, how could we retrieve the user-space caller of this system call? Usually, to find a caller, the first thing to try should be using the backtrace.
In REVEN, the backtrace is built by watching the state of the stack and building an index out of this during the replay phase. Whenever a new call is made, it is added to the known frames of the stack.
What breaks the backtrace for our use case is that there are actually several stacks in the trace.
Even during execution of a user-space program, the program may occasionally change stacks: for instance each thread of execution has its own stack. In a full-system execution, the current stack will change much more frequently: it changes whenever the OS decides to switch from a process to another, or when an interrupt occurs, or, most interestingly, when switching from user-space to kernel-space.
In particular, when a system call is made, the stack is first saved somewhere, and then changed. This occurs at the
beginning of Windows’ system call handler, KiSystemCall64:
swapgs
mov qword ptr gs:[0x10], rsp
mov rsp, qword ptr gs:[0x1a8]
The second instruction saves the stack, while the third one changes to a new one.
Due to this, the backtrace shortly after the beginning of a system call will not link to the user-space binary that caused the system call. Such backtraces will appear with gray-italicized entries denoting that we couldn’t rebuild the whole information.
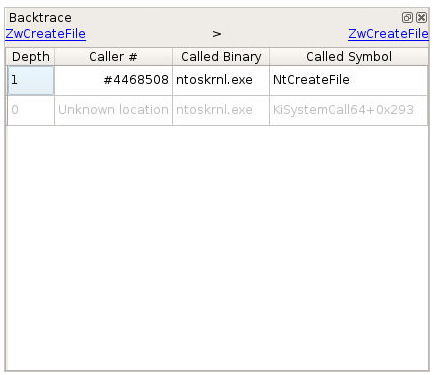
As a result, trying to get back to user-space using simply the backtrace from the system call will not be sufficient in this context.
A detour: using the user-space stubs
In first approach, there is a simple way to side-step the backtrace problem: system calls residing in ntoskrnl.exe
typically have a corresponding user-space function that can be called in ntdll.dll. For example, for
ntoskrnl!NtCreateFile, we have ntdll!ZwCreateFile.
As a result, to find user-space callers, one can simply search for the user-space stubs:
>>> zwcreatefile = next(server.ossi.symbols('^ZwCreateFile$', binary_hint=r'ntdll\.dll'))
>>> for ctx in server.trace.search.symbol(zwcreatefile):
...     print(ctx)
And from user-space, it is easy to get back to the binary that made the system call using the backtrace:
>>> def find_binary(stack):
...     for frame in stack.frames():
...         fr_ctx = frame.first_context
...         ring = fr_ctx.read(reven2.arch.x64.cs) & 3
...         if ring == 0:
...             continue
...         location = fr_ctx.ossi.location()
...         if location is None:
...             continue
...         binary = location.binary
...         if binary.filename.endswith(".exe"):
...             return binary
...
>>> for ctx in server.trace.search.symbol(zwcreatefile):
...     binary = find_binary(ctx.stack)
...     if binary is not None:
...         print("{}: {}".format(ctx, binary.name))
In about 20 seconds, the script generates the following output:
Context before #88836570: csrss
Context before #88907867: csrss
Context before #1119631416: winlogon
Context before #1132576005: winlogon
Context before #1144469259: winlogon
Context before #1144948645: winlogon
Context before #1145397181: winlogon
Context before #1151552073: winlogon
Context before #1151716566: winlogon
Context before #1152134888: winlogon
Context before #1155825527: winlogon
Context before #1156125887: winlogon
Context before #1156430082: winlogon
Context before #1156732179: winlogon
Context before #1157034886: winlogon
Context before #1157333833: winlogon
Context before #1157636263: winlogon
Context before #1157937898: winlogon
Context before #1161542502: winlogon
Context before #1161843318: winlogon
Context before #1162144886: winlogon
Context before #1212421307: logonui
However, there is no obligation for a user-space program to actually use these stubs. They can well just put the offset
of the desired system call into rax, the appropriate parameters, and then use the syscall instruction. Actually
looking to the code of ntdll!ZwCreateFile is enlightening in this context:
mov r10, rcx
mov eax, 0x52
syscall
Reasons to eschew the stubs in favor of raw syscall instructions may include making “stealth” system calls (e.g. for a
malware), so the user-space stubs will not always be sufficient to find all system calls. However, since the offsets of
the system calls change between different versions of Windows (some would say it is on purpose), most programs prefer to
use the user-space stubs, and so this method gives a good first under-approximation.
A “previous stack” based heuristic
Going back from our detour to our original problem, how can we find the user-space caller from a system call such as
ntoskrnl!NtCreateFile?
While we can’t directly use REVEN backtrace, it turns out that the backtrace has one more trick up its sleeve: the previous stack.
REVEN keeps track of all the stack changes and, for a given context, displays the previous and next stacks in the backtrace widget:
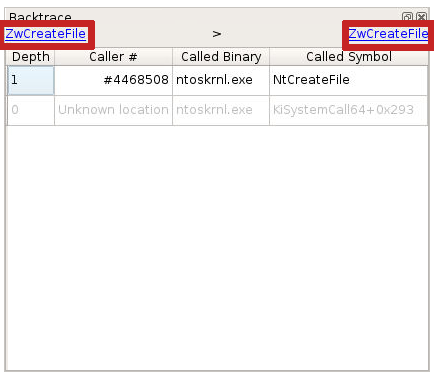
From there, we can use this information to go back from the system call in its kernel-space stack to the user-space caller in the previous user-space stack. In python, that would be:
>>> for ctx in server.trace.search.symbol(ntcreatefile):
...     prev_stack = ctx.stack.prev_stack()
...     binary = find_binary(prev_stack)
...     if binary is not None:
...         print("{}: {}".format(ctx, binary.name))
In about 30 seconds, we get results the following results, similar to the above:
Context before #88836650: csrss
Context before #88907947: csrss
Context before #1119631496: winlogon
Context before #1132576085: winlogon
Context before #1144469339: winlogon
Context before #1144502539: winlogon
Context before #1144948725: winlogon
Context before #1144981908: winlogon
Context before #1145397261: winlogon
Context before #1145432369: winlogon
Context before #1151552153: winlogon
Context before #1151716646: winlogon
Context before #1152134968: winlogon
Context before #1155825607: winlogon
Context before #1156125967: winlogon
Context before #1156430162: winlogon
Context before #1156732259: winlogon
Context before #1157034966: winlogon
Context before #1157333913: winlogon
Context before #1157636343: winlogon
Context before #1157937978: winlogon
Context before #1161542582: winlogon
Context before #1161843398: winlogon
Context before #1162144966: winlogon
Context before #1212421387: logonui
Note that the context numbers are a bit different, because they now refer to the call to NtCreateFile rather than
ZwCreateFile.
Looking at the results, we notice three more winlogon entries than when using the user-space stubs
(ZwCreateFile): #1144502539, #1144981908 and #1145432369.
These entries correspond to calls of ZwUserLoadKeyboardLayoutEx, itself a stub for a system call,
that ends up calling NtCreateFile once in the kernel, which is why it wasn’t detected when looking for user-space
ZwCreateFile calls.
Note that this method is heuristic, as sometimes the previous stack change can be caused by a different event occurring
between the syscall instruction and the actual call to NtCreateFile.
Wrapping up
This article presented two ways of finding back the process responsible for a given system call: a simple way based
on user-space stubs, and a heuristic way using the “previous backtrace” feature of the backtrace.
You can find the cleaned up, commented script here. The script also highlights some good practices when writing REVEN scripts (e.g. regarding server port handling), so do not hesitate to use it as a template for your own scripts.
While the solutions presented here to the problem of finding processes responsible for system calls are not perfect, they are a good fit to understand the REVEN Python API. If you are interested in simpler and more correct solutions to this problem, keep in tune, as REVEN 2.3 might have something in store for you…
