

Profiling Windows execution with system timeless analysis
An unused system is not a suspended system! Discover in this article how we measured some Windows 10 background activity with timeless analysis in various configurations.
The multiple applications of system-wide timeless analysis range from the obvious, like “a debugger you don’t have to restart all the time”, the less known ones, like enabling root-cause oriented data flow analysis (“backward taint”), to the more exotic ones, that we keep experimenting on at Tetrane.
Compared to previous versions of Windows and other operating systems, emulating Windows 10 in QEMU can suffer from performance issues. For the purpose of recording QEMU VMs with REVEN, we strongly suggest to lighten the Virtual Machine (VM) used in the record, so as to maximize performance by reducing replay time and trace storage. In REVEN 2.5, we streamlined this process by providing a script and an NTLite template you can use in our VM configuration process.
To determine the contents of the template and evaluate its usefulness in terms of improving record performance, we actually used the system-wide timeless analysis abilities provided by REVEN! In a way, this process is akin to profiling the Windows operating system itself.
In this article, I will detail the approach followed by my colleague Dinh in his evaluation of the impact of various Windows system configurations using REVEN, and the results he obtained.
Setting the stage
When you perform an analysis with REVEN, REVEN will record your target scenario as well as the whole system execution. But probably, everything that is not your scenario is noise to you. Therefore, our goal in this study is to minimize this noise: in the trace and in the tools that analyze the trace.
In order to measure how much noise is recorded, we had to carefully craft our target recording as it could obviously influence the results of our study.
We chose to record a VM that had reached a state that is the recommended one for working with REVEN: an “idle” VM, that is one that maintained a “low” CPU usage for a few seconds. This setup allowed to focus the recording on the “background noise” of the operating system.
The experiments
From there, Dinh made several records using a tailor-made program. This program would do the following:
- measure CPU activity by using the
GetSystemTimesWindows API entry, - automatically start recording using ASM stub when the system load is low,
- wait for some fixed time, then
- automatically stop the recording with ASM stub.
In order to test various configurations, the test program was configurable so that it stops various Windows services upon starting.
Tested VM configurations include a “vanilla” Windows 10 VM, that same VM after applying Tetrane’s sample Windows VM lightening script, and, once the template was done, the VM after applying the NTLite template.
For each record in one of the various configurations, the corresponding REVEN trace was generated, and then a REVEN Python API script was run to measure which processes were majoritarily present in the trace, sorting by instruction count.
"""
Associate to each value of the CR3 register a process and a number of executed instructions.

This allows to determine how much instructions are executed by process.
"""

def cr3_changes(trace):
    """
    Helper function to iterate on all `reven2.Context`s that are located after a change in the value of CR3.
    """
    ctx = trace.first_context
    while True:
        ctx = ctx.find_register_change(regs.cr3)
        if ctx is None:
            break
        yield ctx

cr3s = {}  # Dictionary of CR3 -> (Process, executed instructions)
last_transition_id = 0  # Use to compute the executed instruction delta
last_cr3 = trace.first_context.read(regs.cr3)  # Previous value of the CR3.

cr3s[last_cr3] = list((trace.first_context.ossi.process(), 0))
for ctx in cr3_changes(server.trace):
    transition_id_delta = ctx.transition_before().id - last_transition_id
    last_transition_id = ctx.transition_before().id
    cr3s[last_cr3][1] += transition_id_delta

    cr3 = ctx.read(regs.cr3)

    if cr3 not in cr3s:
        cr3s[cr3] = list((ctx.ossi.process(), 0))

    last_cr3 = cr3

# After this loop, cr3s contains all CR3 values in the trace, each associated to the first process seen with this
# value of the CR3 and the number of instructions executed with this value of CR3.
Why using the instruction count? It is representative of the performance characteristics that we want to act upon: trace size, processing time, storage size. It is also an estimate of what is happening in the VM.
Besides, it turns out that it is easy to measure with REVEN :-). Since REVEN is working system-wide, the count of instructions fully includes those that are hidden behind a syscall.
We also measured the sizes of the recorded and replayed trace, as it is another metric that is important to REVEN users.
Results
We compiled the resulting data in a simple spreadsheet and then generated various diagrams from the data to obtain a synthetic view.
The following table lists the tested configurations:
| Configuration name | Description |
|---|---|
| A | Windows 10 VM without modification ("vanilla") |
| B | A with [Windows 10 debloater](https://github.com/Sycnex/Windows10Debloater), Tetrane's sample lightener and Graphic Effects disabled |
| C | B with unnecssary services/processes disabled, DWM suspended and memory compression disabled programmatically |
| D | C with memory compression disabled in snapshot, firewall disabled and antimalware disabled |
| E | A after applying Dinh's NTLite template, 500ms |
| F | Windows |
And the following is a diagram that summarizes the relative performance of the configurations according to space and time:
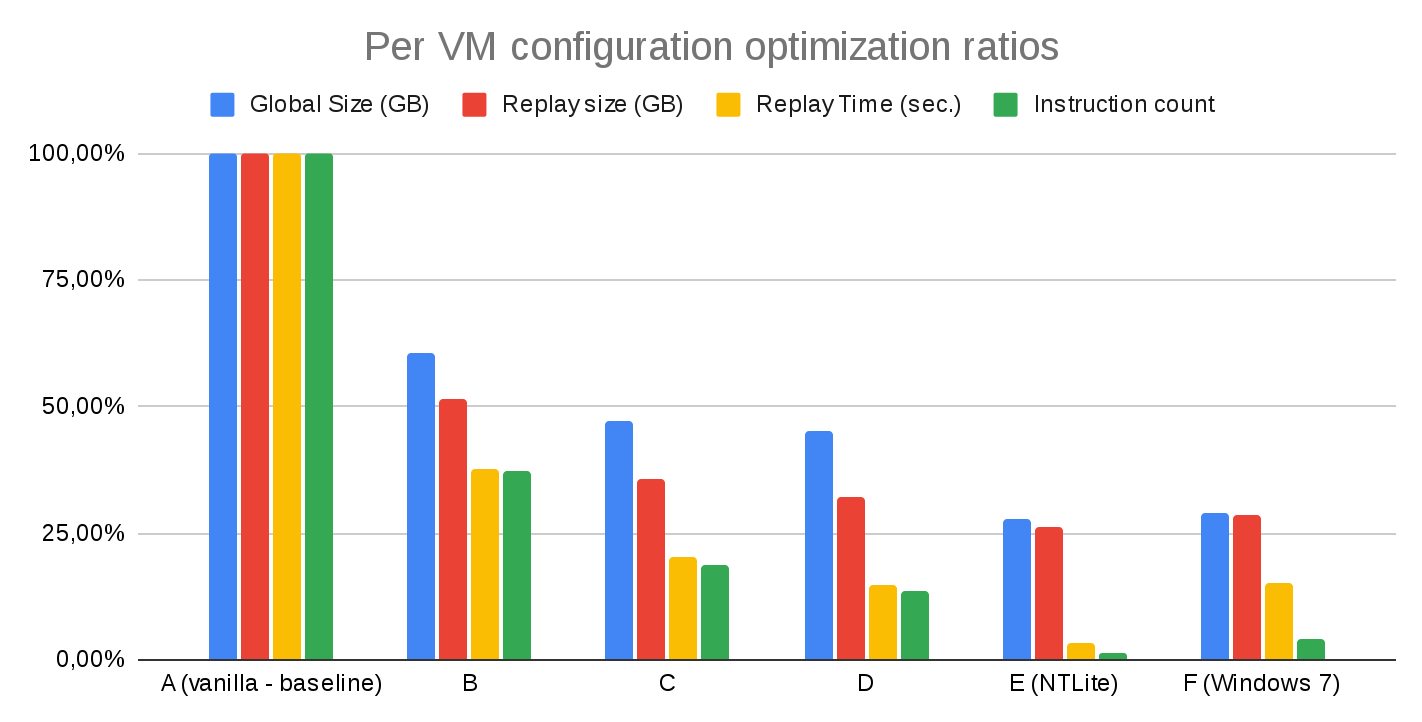
These results allowed us to draw several conclusions about the performance of the tested configurations:
- Suspending/Terminating the Desktop Windows Manager reduces the noise. However, it also spoils the UX so it should probably be avoided unless the scenario uses no GUI at all.
- Tetrane’s sample Windows VM lightening script and disabling the graphic effects is a 2/3 performance win on both instruction count and execution time.
- A 1/5 to 1/4 win is further obtained by disabling memory compression, suspending/disabling some more executables and services.
- Dinh’s NTLite template does a great job on Windows 10, taking the level of background noise below the load level of a vanilla Windows 7 VM, while still keeping the network stack enabled. Of course, still it is possible to further improve performance by disabling the network stack, but it is inconvenient for many scenarios)
If you’re interested in the numeric results of the experiments, you can find them listed in the table at the end of this article.
Conclusion
Our experiments produced a few interesting observations that guided our choice of how to build the NTLite template, and also allowed us to provide a measure of its effectiveness.
Our setup is suited to REVEN, with no GPU acceleration and full emulation enabled.
Nevertheless, this demonstrates an original use case of REVEN as a profiler of sorts. The approach could be extended to e.g. profiling applications, complete with the cost of their syscalls.
A full blown “timeless” callgrind working on a REVEN recorded trace is not out of reach, as the analysis API provides all the necessary bricks.
Since REVEN is system-wide, such a performance tool would be able to profile full systems, and timeless analysis means that the analysis can be done “offline”, purely by observing the system, without instrumenting it. Also, as always with timeless analysis, distinct analyses can be performed at different points in time without having to record again the analyzed system or application.
Appendix: detailed results
The next tables list the raw results obtained in the tested configurations, first for the disk space, then for the replay time and number of instructions.
| Configuration name | GlobalSize (Go) | RatioGlobalSize/Vanilla | ReplaySize(Go) | RatioReplaysize(Go) |
|---|---|---|---|---|
| A | 10.4 | 100.00% | 8.7 | 100.00% |
| B | 6.3 | 60.58% | 4.5 | 51.72% |
| C | 4.9 | 47.12% | 3.1 | 35.63% |
| D | 4.7 | 45.19% | 2.8 | 32.18% |
| E | 2.9 | 27.88% | 2.3 | 26.44% |
| F | 3 | 28.85% | 2.5 | 28.74% |
| Configuration name | ReplayTime (sec.) | RatioReplayTime/Vanilla | # instructions | RatioInstr/Vanilla |
|---|---|---|---|---|
| A | 313 | 100.00% | 125905532 | 100.00% |
| B | 118 | 37.70% | 47064399 | 37.38% |
| C | 63 | 20.13% | 23378474 | 18.57% |
| D | 46 | 14.70% | 17254112 | 13.70% |
| E | 11 | 3.51% | 1678196 | 1.33% |
| F | 48 | 15.34% | 4984382 | 3.96% |
