Announcing REVEN version 2.9
Discover Timeless Analysis Live.
Tetrane is pleased to announce the release of REVEN Enterprise and REVEN Professional 2.9.
REVEN is a Timeless Debugging and Analysis (TDnA) Platform designed to go x10 faster & x10 deeper while reverse engineering. Technically, REVEN captures a time slice of a full system execution (CPU, Memory, Hardware events) to provide unique analysis features that speed up and scale your reverse engineering process.
REVEN version 2.9 brings several debugger-like features to the Axion GUI, such as memory watchers and the “Step in/out/over” commands. Naturally, these features benefit from the timeless nature of REVEN, allowing to access the value displayed by a memory watcher anywhere in the trace, or to step out backward!
On the automation side, the “step” commands are also made available through the Python API. Besides, new scripts demonstrate how to use the existing bookmark methods of the API to, for instance, generate a report from the bookmarks created during analysis.
This article covers these new features and tools and the other important changes introduced in the REVEN 2.9 release.
We also made a video (15min) to briefly demonstrate the highlights of this release (chapters are set to access each feature directly).
Watching memory in your scenarios
It is very useful to track a value over the course of the trace to identify where changes occur or to observe it at specific moments you have bookmarked. We added Memory watchers for this purpose. It allows you to monitor the content of virtual memory at any range of addresses and display its value formatted according to the type of value.
Create a memory watcher from any Hexdump view or from selecting an address in the Trace view:
Like bookmarks, memory watchers are associated to a scenario, and persist between restarts of Axion or the REVEN server. Besides, creation of memory watchers is synchronized between concurrent Axion sessions of several users.
Enhanced transition display
Ever wished to know at a glance where a transition that is displayed in a view in Axion falls with regard to the currently selected transition in the Trace view? Or whether a given transition is more at the beginning of the trace or at the end?
With REVEN 2.9, it is easier than ever to answer these questions: Any transition displayed in an Axion view is now prefixed by an icon that indicates how far before or after it is from the currently selected transition.
Moreover, hovering a transition with the mouse anywhere in Axion will display its location in the timeline! A vertical blue line will tell you the relative position of the hovered transition with regard to the current one, bookmarked transitions, etc.
Navigating like in a debugger, forward and also backward!
REVEN 2.9 adds 6 navigation buttons to the toolbar:  .
.
These buttons brings to REVEN the classic debugger controls, allowing you to step in/out/over a function call.
With REVEN being timeless, it is of course possible to also perform these actions backward! This change allows to quickly find the entry/exit of a function call, wherever you are in the function.
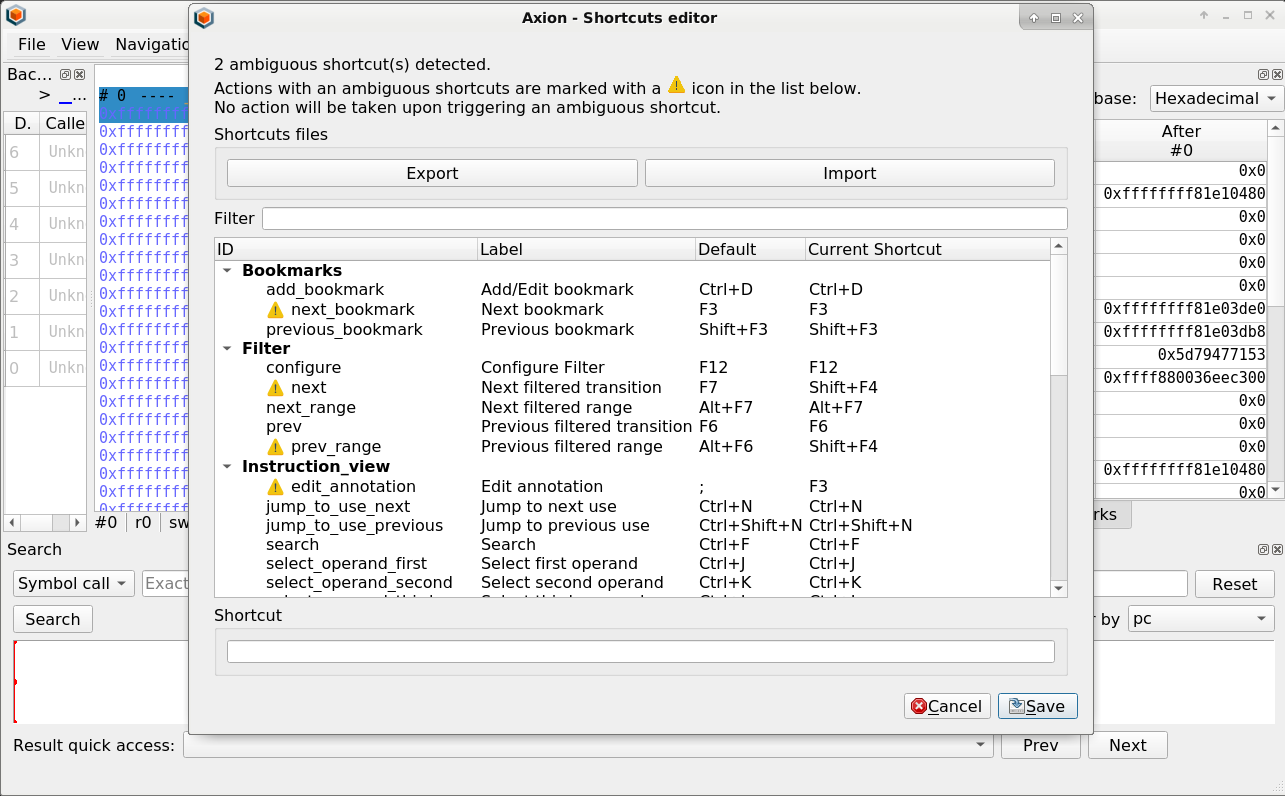
The actions are accompanied by the standard debugger shortcuts, with a small twist: we also want the shortcuts to work for going backward in the trace. The most natural way we found to do that was to use the Shift modifier to go backward. However traditionally in debuggers step in is on F11 and step out is on Shift+F11, so we had to adapt the usual shortcuts and have step out on F12.
The final action/shortcut table reads:
| Action | Default shortcut |
|---|---|
| step over | F10 |
| step over backward | Shift + F10 |
| step into | F11 |
| step into backward | Shift + F11 |
| step out | F12 |
| step out backward | Shift + F12 |
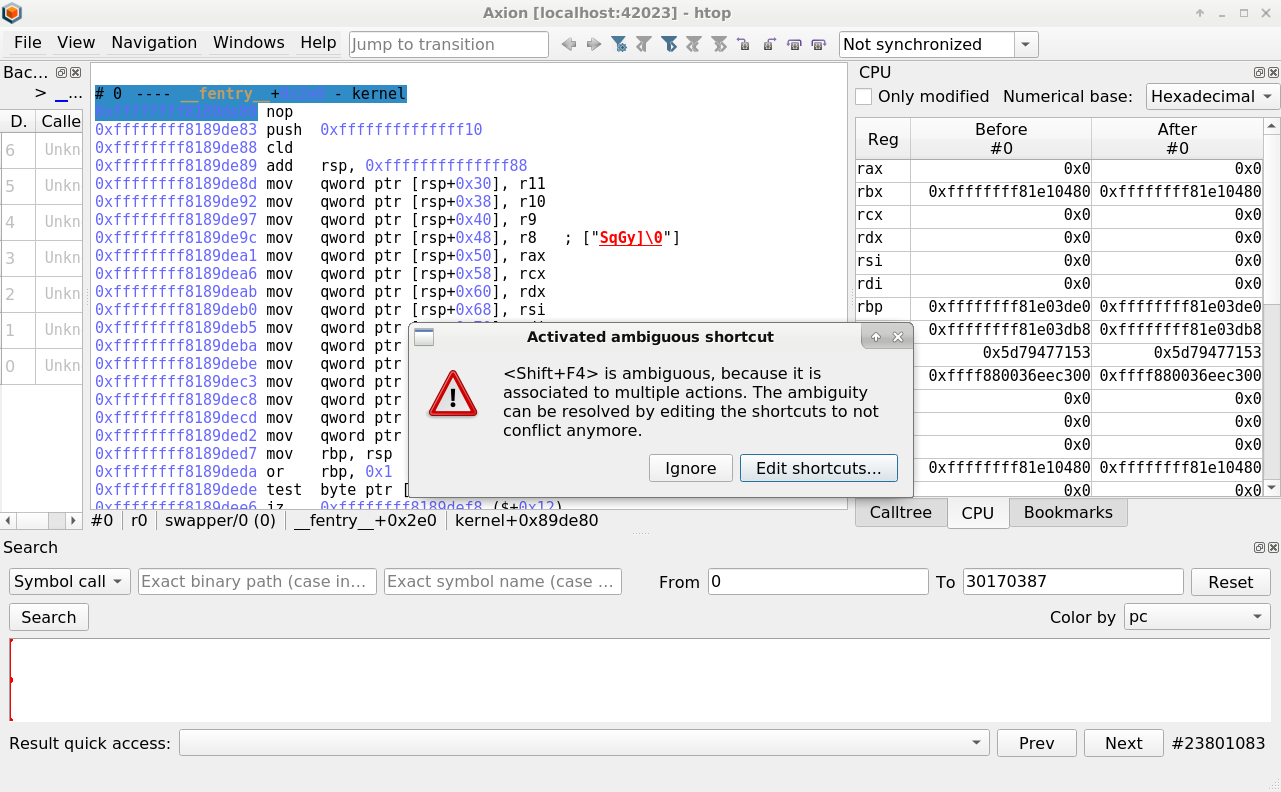
You may want to review the shortcuts in the shortcut editor in Axion, since several of them changed in 2.9. Thankfully, starting with 2.9 it is easier to handle conflicting shortcuts: pressing a conflicting shortcut will display a modal. Besides, the shortcut editor displays conflicting shortcuts so that you can fix the conflicts.


Also available in the API!
In the Python API, the new methods Transition.step_out and Transition.step_over serve the same purpose.
In particular, from anywhere in a function, use Transition.step_out() to get to a transition where the return value of the function is available, and Transition.step_out(is_forward=False) to get to a transition where the parameters of
the function are available:
# Find the first parameter and the return value from any transition.
#
# Note: this assumes standard Windows 64-bit calling conventions, and that the there is one pointer-sized argument and
# one pointer-sized return value. For more precise signature recovery, see reven2-ltrace.
def print_first_parameter_and_return_value(tr: reven2.trace.Transition) -> None:
    loc = tr.context_before().ossi.location()
    if loc is None:
        loc = "???"
    first_tr = tr.step_out(is_forward=False)
    if first_tr is None:
        first_param = "???"
    else:
        first_param = hex(first_tr.context_before().read(reven2.arch.x64.rcx))
    last_tr = tr.step_out()
    if last_tr is None:
        ret = "???"
    else:
        ret = hex(last_tr.context_before().read(reven2.arch.x64.rax))
    print(f"{loc}: first_param={first_param}, ret={ret}")
Calling this function in diverse locations of the tokio_chat scenario yields the following outputs:
>>> import reven2
>>> # Host and port of the running the scenario
>>> host = '127.0.0.1' # to be customized
>>> port = 13370       # to be customized
>>> server = reven2.RevenServer(host, port)
>>> print_first_parameter_and_return_value(server.trace.transition(955083))
ntoskrnl!ExAllocatePoolWithTag+0x51: first_param=0x200, ret=0xffffe0016ba01710
>>> print_first_parameter_and_return_value(server.trace.transition(2039312))
ntoskrnl!NtReadFile+0x83: first_param=0xffffffff80000420, ret=0x0
>>> print_first_parameter_and_return_value(server.trace.transition(15533135)
ntoskrnl!NtWriteFile+0x478: first_param=0x224, ret=0x0
Getting parameters and the return value of a function is a very useful use-case that is easily enabled by these API additions.
Sharing & communicating your findings
The ability to write interactive write-ups with REVEN and Jupyter allows you to build your write-up while analyzing a REVEN scenario, with the convenience of Markdown and the interactivity of the REVEN Python API. How to integrate the bookmarks added during manual analysis with the Axion GUI to such reports?
With REVEN 2.9, it becomes easier to share your findings in a report or to communicate information to a colleague about specific areas of interest, etc. You generate a Markdown/HTML report which includes data related to bookmarks (position, title & comments, code related). Bookmarks can be set interactively within REVEN UI or automatically using the API to mark detected POIs. The script can easily be customized to your own needs.
If used from within your own notebook with the appropriate option set, the report will be generated inline.
Find this example on GitHub.
Moving quickly to live debugging with WinDbg
Sometimes you need to switch to live debugging of your target using WinDbg, for instance, to tweak a value and observe the impact. You just want to get to the moment you are interested in within WinDbg. It’s easy now! Mark those moments using REVEN bookmarks and convert them into WindDbg breakpoints.
The bk2bp.py script generates a list of WinDbg commands that adds the breakpoints corresponding to the current PC at the transition of each of your bookmarks.
The generated WinDbg commands can then be added to WinDbg, either connected to the same REVEN scenario, or simply to reuse the breakpoints on a live debugged VM.
Find this example on GitHub.
Faster and more complete symbol parsing
OSSI is the OS Specific Information that is rebuilt by REVEN from the state of a scenario, to provide higher-level information such as the current process or the currently called symbol. OSSI is a very important aid to analyzing a scenario.
REVEN 2.9 improves Windows OSSI by introducing a new backend to parse PDBs that uses the pdb crate.
The new backend fixes some reliability issues, exposes the private symbols as well as the
symbols in PDB modules, and does so much faster than before: up to 4x the speed.
Regarding Linux OSSI support, this version also brings several fixes and improvements, such as the ability for REVEN to load symbols from debug binaries if available at the standard locations looked up by GDB.
Expect more on the OSSI front in the future.
And More
- Iterate over all memory accesses in a transition range from the API.
- Use the new
detect_data_race.ipynbnotebook to look for data races in Windows programs whose synchronization depends on critical sections. - Rename your
Hexdumpsviews in Axion, select which one gets replaced when you need to display another address.
The full list of improvements and fixes is available in the release notes.
Want to try REVEN? An extensive set of learning scenarios is available online, so just visit our Try REVEN page! Tutorials are available in most demos.
Interested in REVEN? Compare the features of REVEN Professional and REVEN Enterprise.
Discover Timeless Analysis Live.

