

Recording vulnerabilities related to non-deterministic bugs, crashes or other complex cases
by Mathieu
Categories: REVEN -
Tags: Reverse Engineering - REVEN - Crash - Fuzzing - Automation -
To analyze non-deterministic bugs or crashes, one must be able to observe exactly what happens when the problem occurs. This is a notoriously tedious task when working with a debugger or from logs. However with REVEN, once you capture the exact period of time during which the problem happens, then our timeless debugging and analysis platform makes it easier to observe it and understand its root cause.
This article discusses how REVEN’s features enable creating efficient recordings of those random bugs and crashes that can lead to severe vulnerabilities. When, and perhaps more importantly, how are these features meant to be used?
We will start with typical use cases, to build up to more complex ones such as non-deterministic OS crashes. We will see how in these situations we can leverage recording automation, especially thanks to a new feature we introduce in version 2.8.0. Before we start, a few notes: what is described in this article applies to the recording of QEMU VMs via Panda, not the VirtualBox recorder, and in general applies to Windows guests. Also, you can find more details in the documentation.
Necessary context
Manual recording
First, let us look at how manual recording works.
We demonstrated this mode in a previous article, but in a nutshell: at any point in time while the target guest VM is running, the user can hit the “Start record” button in the Project Manager’s GUI.
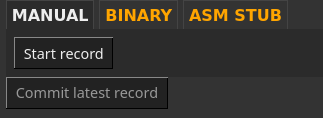
From that point on, everything that happens on the VM is recorded, and the user can set the process she wants to create a trace of in motion: start a command in the guest, or click on a button, etc. Once that is over, she can click on the “Stop record”1 button that since replaced the “Start”. At that point we have a valid recording we can replay & analyse2.
Why we need more control
While manual mode is very easy to use, it tends to produce traces that are bigger than necessary. For instance, since the recording is started & stopped by hand, it will always be longer than strictly necessary, no matter how fast we click in the interface. Moreover, visible clues are required for the user to know when to start and stop: active monitoring may be required, like keeping a task manager open. This additional activity, although irrelevant, will be recorded. This in turn means longer replay times and more disk space usage, both of which we really want to optimize.
Using more advanced recording techniques will enable a more precise start & stop, avoiding the capture of irrelevant activity, producing leaner recordings. Depending on the use case, we can imagine reducing the trace size by a factor of 2 or even up to 10 - this could mean taking a coffee break while the process is replaying instead of going out for lunch. In general this makes working with REVEN much smoother.
Note: the elephant in the room here is that the VM configuration will also be a contributing factor to the recording size. There is a lot to say in this area, and on this blog we previously dipped our toes into what was possible: See article 2 of our worklow demonstration series of articles, or some profiling we did on a Windows 10 VM.
In practice, this finer control will take the form of automation of the recording process.
Another reason we want more control and automation is to enable fully automated workflows, such as automatically recording crashes detected by a fuzzer. The Project Manager is controllable through the API so we can create new projects and restore VMs, but we still need proper handles to take actions within the guest VM and synchronize the recording process.
Architecture
As can be seen in the automatic record demo, REVEN provides multiple means to automate recordings. You can use those via the Project Manager GUI, in which case it will help you produce a small, manageable recording of an otherwise complex process. If you hold an Enterprise REVEN license, you can also use these features via the Project Manager’s Python API, to plug the recording process into an existing automated workflow like a fuzzer.
There are a few moving pieces we need to understand. Below, in green, are the parts of REVEN that we will discuss in this article: the Virtual Machine instrospection that monitors the VM activity and the Project’s manager automatic recording logic.

Note that there are really two levels of automation here:
- The recording logic with regard to the operation of getting a record out of a running system, that can help a user even when recording manually from the VM GUI.
- The Project Manager’s API that enables a user to control and automate its workflow, from launching a VM to analyzing a scenario.
The perimeter of the latter is strictly similar to that of the Project Manager’s GUI. In this article we will concentrate on the former and we will introduce the logic of three recording modes: binary based, asm-stub based, and mixed.
In particular, one use case we will not cover here is long recordings: when you have a long process and need to keep the last few minutes of it. It might make sense to split this long timespan into multiple recordings, keeping only the last few ones. The Project Manager’s API can help you doing so.
Binary recording
We can now look at the first automatic mode: binary recording3 - this is what is demonstrated in the article mentionned above.
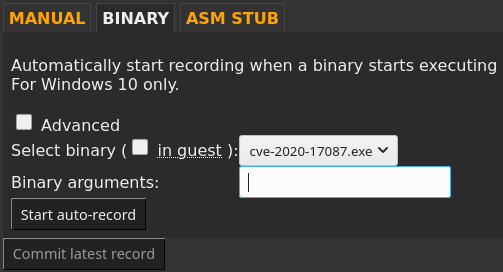
The user specifies a binary, along with the necessary resources and command line. Then REVEN uploads everything to the VM, executes the command line, and starts monitoring the VM so as to start recording precisely when the process starts and stop recording when the process exits, crashes, or if the OS itself crashes:

Note: while by default REVEN starts the command line automatically as shown in the drawing above, we can also select another command to start or even disable that step and run our process manually - this is what the Advanced check-box above hides away. This autorun is separated from the rest of the automatic recording logic, so REVEN will still start & stop the recording automatically when the specified process starts.
Using this mode through the GUI makes it simpler to produce recordings that are already leaner than before: no manual actions on the VM is stricly required (although interactions are still possible as usual), no keyboard entry to start the process or hasty clicks on the Project Manager’s buttons.
Moreover, using this we can already plug REVEN on the output of a fuzzer - using the Project Manager’s API, we specify where to find the harness and the crash-inducing input, and REVEN will create a recording of the crash. We provide script examples that can be adapted in that direction:
$ ./advanced-automatic-crashing-binary-record.py --snapshot 36 --live-snp "autorecord-2048M-nonet-nokvm" --local-binary ~/fuzz-xm/loader/loader.exe --extra-files ~/fuzz-xm/output/crash_0x12345.case --args crash_0x12345.case --name crash_0x12345_1
Scenario "automatic-binary-scenario" created with id 144

QEMU session started
Record started
Recorder status: Not ready
[...]
Recorder status: Ready
[...]
Recorder status: Recording
[...]
Recorder status: Record completed
Record saved in scenario crash_0x12345_1
Session has been stopped
Here we automatically upload a harness along with a test case to the VM and record the execution of the harness until the process crashes. From there, we can manually analyze the trace, or start a Python script that uses the Analysis API to automatically build a report.
ASM stub: control the recording from guest-side code
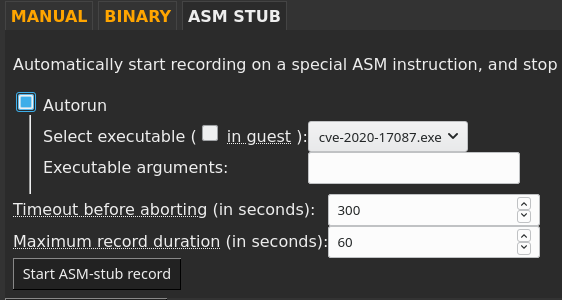
There are situations where binary-level recording is still too coarse grained. If we need more control, we can switch over to the manual ASM stub4 mode. In this mode, REVEN provides a backchannel to let the guest VM send commands to the host to control the recording.

These commands take the form of magic instructions, defined in a C header. You can call them in various ways:
- incorporate them into your existing programs,
- use them when placing hooks on library calls,
- or create a separate binary to call from higher-level languages like Python.
Regardless of how they get called, the situations in which they are useful are similar. Let us look at a few examples:
Specific condition
Imagine the following situation: we have a function called non_deterministic_function which returns values based on conditions we neither understand nor control.
int main(int argc, char* argv[]) {
	lengthy_stuff();

	int value = non_deterministic_function();

	more_lenghty_code(value);

	return 0;
}
If we are interested in recording a trace of that function returning 0x42, we could edit the source to something like the following, to produce our recording5:
int main(int argc, char* argv[]) {
	lengthy_stuff();

	// Start the recording as close to our function as possible
	host_start_record();
	int value = non_deterministic_function();
	host_stop_record();

	if (value == 0x42) {
		// Tell the host we want to keep the latest record
		// This will stop the recording process
		host_commit_record();
	} else {
		host_abort("Could not generate desired value");
	}

	// This will never be recorded
	more_lenghty_stuff(value);

	return 0;
}
Note how we can check conditions on the recording we just made in order to take actions: either accept the recording as valid or inform the host that our recording is not successful and should be aborted.
The result of this will be a clear status in the Project Manager: if your recording is successful, you know it contains what you expect. If on the other hand it isn’t, the failure is explicit and you can chose to try again, and even do so automatically if you are automating this process with the Project Manager’s API.
Moreover if non_deterministic_function can be restarted safely in your program, you could also make multiple tries during the same run:
	// [...]
	// Iterate until we get what we want, or we make too many iterations
	int value = 0;
	for(int i=0; i < 1000; ++i) {
		host_start_record();
		value = non_deterministic_function();
		host_stop_record();

		if (value == 0x42) {
			host_commit_record();
			break;
		}
	}
	if (value != 0x42) {
		host_abort("Could not generate desired value");
	}
Restarting the recording from within the VM is possible, and here a valid trace will contain a single iteration of the loop.
Finally, all commands can be run from different processes. You could start the recording from process A, get process B started and running, wait a while, and finally stop the recording from process C, all wrapped in a Powershell script or started manually from the VM’s GUI.
Modified fuzzer harness
The above example paves the path to recording fuzzer harnesses as well. Since these latter are often optimized to run a tight loop of the target code, we can adapt their code to handle the recording as well:
	// [..] Initialization

	// while(__AFL_LOOP(1000))
	// Input may not generate a deterministic crash, so keep code wrapped in a loop
	for(int i=0; i < 1000; ++i)
	{
		host_start_record();

		ModPlugFile* mod_file = ModPlug_Load(filename);
		const int i_read = ModPlug_Read(mod_file, chunk_buffer, chunk_size);
		ModPlug_Unload(mod_file);

		// Did not crash yet
		host_stop_record();
	}

	host_abort("Could not generate a crash");
But what about when the program crashes? Up until 2.7.0, full manual ASM Stub mode was your only option if you wanted this kind of control over your recording - and since it does not stop it automatically, you had to register signal or exception handlers to catch the program crash and stop the recording from there. Up until 2.7.0 that was the recommended solution, but in 2.8.0 we enable mixing both modes.
Mixing ASM stub in Binary recording mode
Starting with 2.8.0 we can now use ASM Stub host commands from within a binary while in binary recording mode. This allows leveraging the automation of the binary mode (catch the process start or crash), but keep fine control over the recording where necessary.

This means that we can run our modified fuzzer harness above with no further modification in binary recording mode: the start command will restart the recording, and the process crash will trigger a recording stop. Here are two other example use cases made easier to record effectively by this mixed mode: kernel crash and service crash.
Kernel-mode crash
In this use case we want to record a non-deterministic6 vulnerability in a driver, via a proof-of-concept program.
 Generally speaking, starting a recording takes about one second. In this example, let us assume each attempt at crashing takes only a few milliseconds. If dozens of thousands of tries are necessary to trigger the crash, restarting the recording every time would make the recording process take way too long. We make a compromise and decide to perform several recordings, each containing up to 1000 attempts each time. The process then goes as follow:
- The user asks to automatically record
PoC.exewith autorun, PoC.exegets uploaded to the VM and starts,- (1) This process creation is detected & the recording starts,
- At that point,
PoC.exeloops on the following:- (2) Request to restart the recording,
- (3) Try to force the OS crash 1000 times.
- (4) At one point the OS ends up crashing - this condition is detected and the recording stops. So here, in case of success, we end up with a rather lean recording that contains at most 1000 tries and… the target crash!
Service crash
Similarly we can record a crash of a service, by specifying which service to record. For this example we consider a deterministic crash, so there is no need for a loop - but the manual recording restart is still useful.

In this example, the process goes as follow:
- The user asks to automatically record
myservice.exewithout autorun, - (1) The user manually restart
myservice.exe, - (2) This process creation is detected & the recording starts,
- At that point,
PoC.exe:- (3) Gets started by the user
- (4) Requests a recording restart
- (5) Triggers the crashing condition.
- (6) The service crashes - this condition is detected and the recording stops.
So here we end up with another rather lean recording that contains only the root cause and service crash perimeter.
Conclusion
In this article, we have seen the automatic recording features provided by REVEN out of the box. Through a few examples we explored the situations where they can be easily applied to produce recordings automatically: non-deterministic crashes, OS crashes, multi-process interactions (services) or when specific conditions can only be checked from within the VM. Using these, we also get a clear status in the Project Manager of whether the recording contains what we want to analyze. Automatic recording is necessary when building a fully automated recording workflow, but that is not the whole story - the leaner a recording is, the easier it is to work with. As such, having the tools to easily produce light recordings of complex situations makes for an overall much rewarding REVEN experience.
-
Note: since that linked video, we changed the process a little bit: we used to always keep the latest recording and discard others, but instead we now require the user to click on “Commit record” after “Stop record”. This allows for more flexibility when trying to get a good recording. ↩
-
For more information about the overhead incurred by the recording, please refer to the FAQ entry. ↩
-
Note: as of version 2.8.0, this recording mode is restricted to 64-bit Windows 10 guests only. ↩
-
Note: this fully manual mode is independant from the OS, so it will work in any situation a recording is possible. ↩
-
Or for instance we could hook function calls if this is a library call. ↩
-
Note: if this was a deterministic crash, we could simply use the regular binary recording. ↩
