

Reverse Engineering through trace diffing - several approaches
When doing software discovery or vulnerability analysis, it’s often helpful to analyze the difference between two situations: before/after patches, before/after changing an input, crash/no-crash related to changes in fuzzer-generated inputs, etc.
In this article, we will see how two analysis scenarios in REVEN can be compared by diffing their traces at different levels (code execution, library calls, code filtered by data taint…) and how this quickly sheds some light on unknown code in various situations. Specifically, we will focus on analyzing a proof of concept and a program’s undocumented parameter.
More broadly, we will show some approaches one can take for diffing traces, at which level to do so, and the results one can expect.
Note that the results you will see here have been produced with the following tools:
- A combination of reven-ltrace to produce the ltrace-like outputs and meld for comparing them,
- The diffing notebook.
The principles
Comparing different traces can be done in various situations, but the goal is often similar: focus on the differences to help narrow the analysis on exactly the right area. It gives a better understanding of the code’s logic and reveals new areas of code we should look into.
Comparing runs of the same code
Comparing multiple runs of the same code while varying its inputs can help us:
- understand the impact that input difference will have on the code’s dynamic, and
- highlight portions of the code related to the specific portion of the input we changed
These situations might be:
- isolating part of a crash-inducing input
- in a fuzzer-generated input (we presented such a situation in a previous article),
- in an unknown proof-of-concept.
- investigating a undocumented parameter,
- etc.
There are multiple levels at which we can compare two traces, which we will look at in the examples below.
- Comparing instructions
- Comparing calls
- Comparing taint results
And of course we can compare a custom mix of various elements that make sense in the context of the analysis.
Comparing different versions of the same code
On the other hand, sometimes we need to understand the difference between two versions of similar code, for example to find:
- how a vulnerability has been patched in a binary
- whether regressions have been introduced
- what impact a new compiler option has on the generated code
- etc.
In all these situations, starting from the code in an actual trace can highlight key differences in behavior, narrow the required static analysis and get results faster.
An example: CVE-2020-16898
In the situation of a CVE, we want to get a better understanding of a proof of concept. In the context of CVE-2020-16898 (a crash in the tcpip.sys driver), we will take a look at Quarkslab’s PoC.
Note: you can find Quarkslab’s article here. It is comprehensively detailed and does explain the details we will reconstruct in this article.
You can already analyze a recording of the crash in the associated demo CVE-2020-16898 to get some insight about the problem. In a nutshell, the crash makes it easy to locate the approximate region where the bug occurs: Ipv6pHandleRouterAdvertisement calls NdisGetDataBuffer to get network data, but specifies a size of 0x110, way larger than the stack-allocated destination buffer. This effectively makes the called function overwrite the security cookie. When it exits, the security check triggers the crash. It turns out the size 0x110 passed as a parameter comes almost directly from the network request (a value of 0x22, multiplied by 8 equals 0x110).
Still, this does not explain the setup that makes this crash possible in the first place. Isn’t the network data validated? We will take a closer look at this setup in this article. In particular, we will compare two traces:
- In the first recording we run an inactivated PoC, modified to send regular packets (see Annex 3), so the VM does not crash.
- In the second recording we run the PoC unmodified and let it crash our VM. This is the trace of the demo CVE-2020-16898 we mentionned above.
While we might be tempted to make a diff of all the instructions that were executed in each scenario, at this stage of the analysis it is too soon as it would yield a large number of results.
Comparing calls
Instead, let us start with a broader brush and compare the results of the REVEN’s ltrace command. Running a program twice, even on very similar snapshots, will necessarily produce different addresses and transition numbers, so we setup our diff tool to ignore those.
On the left we will have the trace that does not crash, and on the right the one that does:
Apart from a few irrelevant outliers that are trivial to rule out, we find that all differences are located under a single call to a function called Ipv6pHandleRouterAdvertisement.
Comparing coverage
At this point, an analyst would probably load the tcpip.sys file in a disassembler and take a closer look at this function. Having the coverage for both trace would help focusing the analysis on what is relevant to our situation.
For this example, we will generate coverage for the lighthouse1 IDA plugin.
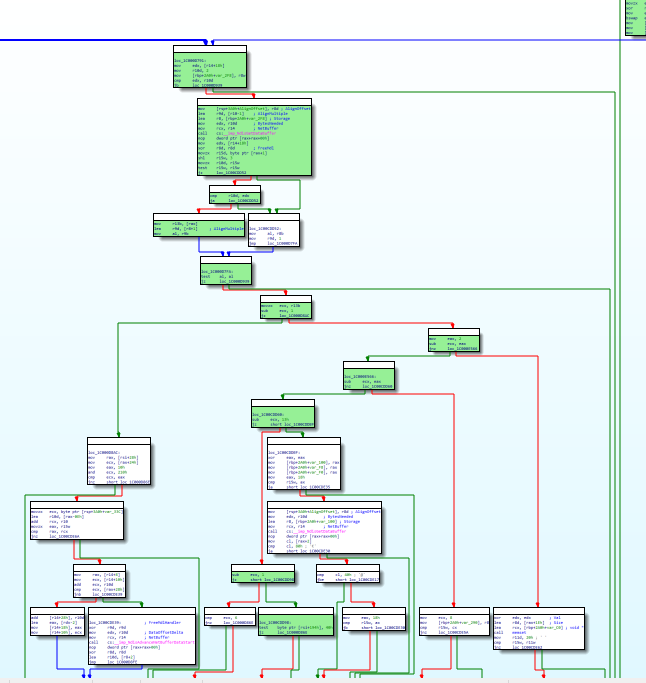
Lighthouse makes it easy to compare multiple coverages, which in some situations might be very useful. Here it reveals the code that leads to the crash itself. However, regular root-cause analysis as presented in the demo CVE-2020-16898 already highlighted this particular code location.
Comparing instructions
Now that everything is ready, we can finally try to compare the two runs of this function. We will walk through every instruction in the function, then use Python’s SequenceMatcher to compare the two and the pandas library to produce a nice table.
The function is more than a thousand instructions long, so printing everything would not be readable. Instead, we will print the differences in blocks, along with transition numbers. If we run this in a Jupyter notebook, we can generate a table we can use to navigate the trace:
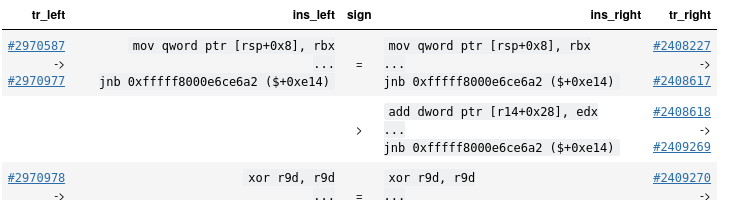
From now on, we will print the results as regular tables in this post - just keep in mind what they would look like in a notebook.
| tr_left | ins_left | sign | ins_right | tr_right |
|---|---|---|---|---|
| 2970587 -> 2970977 |
|
= |
|
2408227 -> 2408617 |
> |
|
2408618 -> 2409269 |
||
| 2970978 -> 2971256 |
|
= |
|
2409270 -> 2409548 |
| [...] | ||||
Using this gives us a new way to look at the code where we can appreciate which portion of the code is similar and focus on the differences.
Customizing the output
The function Ipv6pHandleRouterAdvertisement we are analyzing works on an input buffer, and the bug lies with the interpreter logic. The previous table would greatly benefit from displaying the activity on this buffer somehow: current position, what we do with the data, etc.
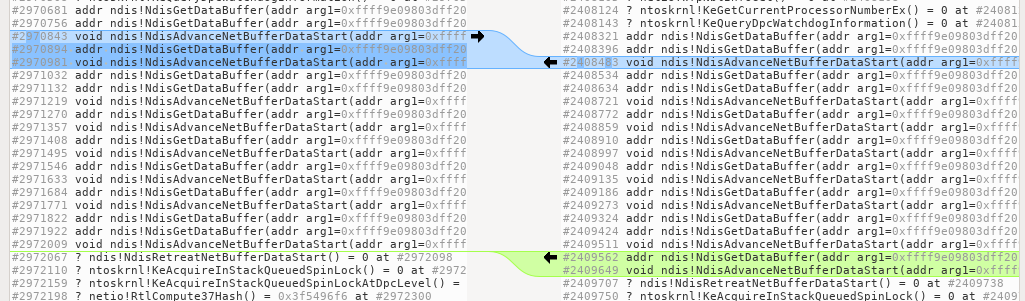
An easy way to do so is to print calls, along with just the relevant arguments & return values. The result would look like the table in Annex 2, of which we reproduced the relevant parts in the two tables below (emphasis added manually for clarity):
| tr_left | ins_left | sign | ins_right | tr_right |
|---|---|---|---|---|
| 2970587 -> 2970977 |
|
= |
|
2408227 -> 2408617 |
| [...] | ||||
Note: this is slightly different than simply comparing calls as we did above. Here the basis for comparison is the instruction level, which helps us group similar code blocks together. The call information is merely additional context tailored to our situation, which in other cases could be register values, offsets, etc.
In this case, it makes it very clear that there are differences between data returned by the calls to NdisGetDataBuffer. The first difference is found in data returned by the first call, but it’s the checksum, so we can ignore it. The second call yields two different buffers between the two traces: 19 05 in one case, 19 04 in the other. The third call to this function returns identical values on both traces.
Looking into it further shows that the start of the function seems to concern itself with types & sizes2, skipping over actual data. We will assume it is actually doing some validation here. Later on, it starts reading the buffer from the beginning again; and this time, it reads the content as well. The part of the diff pertaining to this second step is reproduced below (again, emphasis added manually for clarity):
| tr_left | ins_left | sign | ins_right | tr_right |
|---|---|---|---|---|
| [...] | ||||
| 2971909 -> 2980946 |
|
= |
|
2409549 -> 2417107 |
| 2980947 -> 2980955 |
<> |
|
2417108 -> 2417782 |
|
| 2980956 -> 2980956 |
= |
2417783 -> 2417783 |
||
| 2980957 -> 2981806 |
|
<> |
|
2417784 -> 2422272 |
| 2981807 -> 2981871 |
|
= |
|
2422273 -> 2422337 |
| [...] | ||||
We notice a stark difference compared to the first step: on the right, the second call to NdisGetDataBuffer doesn’t return the same values in the second step as it does in the first : 18 22 instead of 19 05. This is followed by the call to NdisGetDataBuffer(110) which is where the cookie is overwritten.
The function then interprets 42 42, which is probably not valid, so it tries to exit. The final call __security_check_cookie (not shown above) triggers the crash.
This quick diff analysis, along with necessary static analysis made easier with the navigation, reveals the dichotomy that makes the crash possible: types & sizes are checked somehow in a first step but then re-read in a second step to be used. One edge case (19 04) is interpreted differently by both steps. This leads to the second step reading a different portion of the buffer, which allows the attacker to provide unchecked crafted values (18 22) to unsuspecting code and make it overwrite the security cookie.
Comparing different versions of the same code
To complete our example, we will look at the patch microsoft issued for this issue. In a third recording3 we launched the PoC against a patched VM. Of course, this does not produce a crash.
If we tried apply the same trace comparison as above between the crash and this new trace, we would get a rather noisy result. As a matter of fact, instruction’s addresses have changed between the two versions of tcpip.sys we are executing, and maybe some of the code structure as well.
Such results are still exploitable, but require manually filtering out irrelevant differences. We could also try to minimize the noise by comparing more similar versions (immediatly pre-patch and post-patch), but that requires more VM configuration.
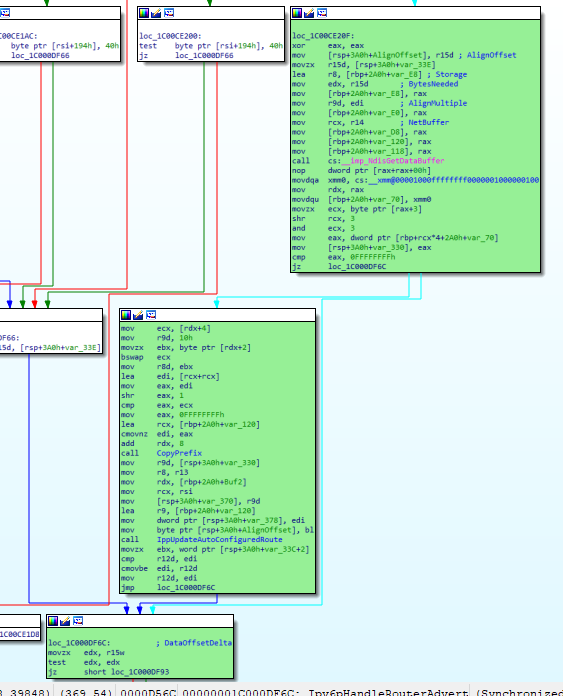
Instead, we will try to focus on the code that is affected by the 04 size value which we saw earlier. This is, after all, the first manual modification the PoC does to the base regular query. To do so, we will taint it forward at the entry of the function, and compare the output of the two taints with a function similar to what we did above.
You can see the full output in Annex 2, of which the relevant part is reproduced below. Keep in mind that we are comparing instructions that somehow manipulate a certain byte from our input. Also, for clarity and because there are far fewer results, we customized the output to print the relevant values (in hexadecimal) along with the instructions.
| tr_left | ins_left | sign | ins_right | tr_right |
|---|---|---|---|---|
| 2408441 -> 2408444 |
|
= |
|
4581184 -> 4581187 |
| [...] | ||||
| 2408469 | |
<> |
|
4581213 -> 4581217 |
| [...] | ||||
Notice how the value 0x4 gets multipled by 8 to become 0x20 in r15. In the next block, the patched trace contains a new piece of code, where we check whether r15’s last nibble is 8. This condition is false here, which triggers an early exit of the function: the edge case is avoided altogether.
Another example: identifying the role of an unknown parameter
In our previous example, the first step was to compare ltrace results to get an overview of the differences. However, while the results did point us in the right function, they were not really exploitable any further, and we had to resort to instruction diffing.
In this example though, the results will be more obvious. We want to understand the behavior of a program when called with an undocumented parameter. To do so, we compare the output of the ltrace command on two traces: in the first we omitted the parameter, and in the second we set it.
There are two differences to be seen. The first one is in the arguments returned by GetCommandLine:

Then, later in the file we see that this argument leads to new functions being called by the program:
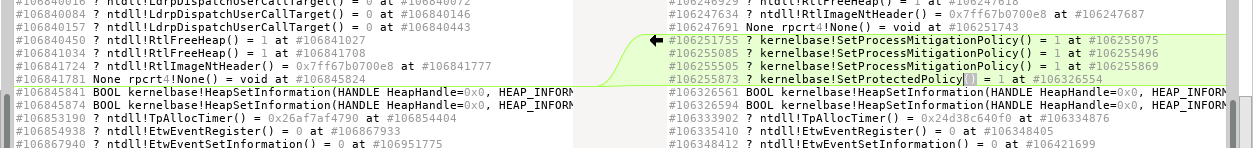
In this case, we are able to get a much more direct answer by comparing calls with no prior analysis. From these results, we can also analyze the trace further starting from the function making these calls:
| tr_left | ins_left | sign | ins_right | tr_right |
|---|---|---|---|---|
| [...] | ||||
| 106846149 -> 106846151 |
|
= |
|
106255396 -> 106255398 |
[...] [...] |
106255399 -> 106255816 |
|||
| [...] | ||||
This reveals the final check - tainting it backward would reveal that a registry key must also be set, in addition to the parameter passed to the command line, for these calls to be made by the program.
Conclusion
In this article we have seen that timeless analysis offer multiple approaches for comparing traces of some scenarios at different levels at will.
We compared sequences of library calls in traces, instructions from traces, instructions from taints, either of identical or different versions of code. It helped us locate vulnerable code, understand the setup of a proof of concept, locate a patch and watch it in action, and also identify the impact of an undocumented parameter.
These comparisons greatly helped isolating the code we needed to take a deeper look at and even provided a straight answer to some of our questions. We encourage you to experiment these principles on your software discovery, vulnerability analysis or malware analysis cases and to tell us more about your experience and diffing needs.
All in all, these different approaches provided intuition and insight about the problems we were analyzing.
Annexes
Annex 1: complete call diff
| tr_left | ins_left | sign | ins_right | tr_right |
|---|---|---|---|---|
| 2970587 -> 2970977 |
|
= |
|
2408227 -> 2408617 |
> |
|
2408618 -> 2409269 |
||
| 2970978 -> 2971256 |
|
= |
|
2409270 -> 2409548 |
| 2971257 -> 2971908 |
|
< |
||
| 2971909 -> 2980946 |
|
= |
|
2409549 -> 2417107 |
| 2980947 -> 2980955 |
<> |
|
2417108 -> 2417782 |
|
| 2980956 -> 2980956 |
= |
2417783 -> 2417783 |
||
| 2980957 -> 2981806 |
|
<> |
|
2417784 -> 2422272 |
| 2981807 -> 2981871 |
|
= |
|
2422273 -> 2422337 |
| 2981872 -> 2989380 |
|
< |
||
| 2989381 -> 2990292 |
|
= |
|
2422338 -> 2423242 |
| 2990299 -> 2990307 |
<> |
2427539 -> 2429118 |
||
| 2990308 -> 2990308 |
= |
2429119 -> 2429119 |
Annex 2: full taint diff
| tr_left | ins_left | sign | ins_right | tr_right |
|---|---|---|---|---|
| 2408441 -> 2408444 |
|
= |
|
4581184 -> 4581187 |
| 2408445 | |
<> |
|
4581188 |
| 2408446 | |
= |
|
4581189 |
| 2408447 | |
<> |
|
4581190 |
| 2408451 -> 2408468 |
|
= |
|
4581195 -> 4581212 |
| 2408469 | |
<> |
|
4581213 -> 4581217 |
| 2408470 | |
= |
|
4581220 |
| 2408472 -> 2409698 |
|
< |
||
| 2409699 -> 2409700 |
|
= |
|
4581223 -> 4581224 |
| 2409701 -> 2427572 |
|
<> |
|
4581320 |
Annex 3: inactivated PoC
def trigger(target_addr):
    ip = IPv6(dst = target_addr)
    ra = ICMPv6ND_RA()

    rdnss = ICMPv6NDOptRDNSS(lifetime=900, dns=[
            "3030:3030:3030:3030:3030:3030:3030:3030",
            "3131:3131:3131:3131:3131:3131:3131:3131"])

    # ---- Inactivation
    # We put an even value for the option length (original length was 5)
    #rdnss.len = len(rdnss.dns) * 2
    #truncated = bytes(rdnss)[: (rdnss.len-1) * 8]

    # The last 8 bytes of the crafted RDNSS option are interpreted as the start of a second option
    # We build a Route Information Option here
    # https://tools.ietf.org/html/rfc4191#section-2.3
    # Second byte (0x22) is the Length. This controls the size of the buffer overflow
    # (in this case, 0x22 * 8 == 0x110 bytes will be written to the stack buffer)
    #routeinfo = b'\x18\x22\xfd\x81\x00\x00\x03\x84'
    # ---- /Inactivation

    # the value that overwrites the return address is taken from here
    correct = ICMPv6NDOptRDNSS(lifetime=900, dns=[
            "4141:4141:4141:4141:4141:4141:4141:4141",
            "4242:4242:4242:4242:4242:4242:4242:4242"])

    # ---- Inactivation
    #crafted = truncated +  routeinfo
    crafted = rdnss
    # ---- /Inactivation

    FH=IPv6ExtHdrFragment()
    ip.hlim = 255
    packet = ip/FH/ra/crafted/correct/correct/correct/correct/correct/correct/correct/correct/correct


    frags=fragment6(packet, 100)
    print("len of packet: %d | number of frags: %d" % (len(packet), len(frags)))
    packet.show()

    for frag in frags:
        send(frag)
-
We do have a tool (alpha) to extract coverage from a REVEN trace and produce a file in this format. Shoot us an email for early access - or if you would rather do it yourself, it is rather easy to generate simple coverage for such small functions. Take a look at the list of lighthouse supported formats, especially the simplest ↩
-
We are here reading Type-Length-Values, for example the type 0x19 is described in the specification ↩
-
This trace is also part of the demo, and with the provided notebook you can reproduce the results we will see here. ↩
